data point
What is a data point?
A data point is a discrete unit of information. In a general sense, any single fact is a data point. The term data point is roughly equivalent to datum, the singular form of data.
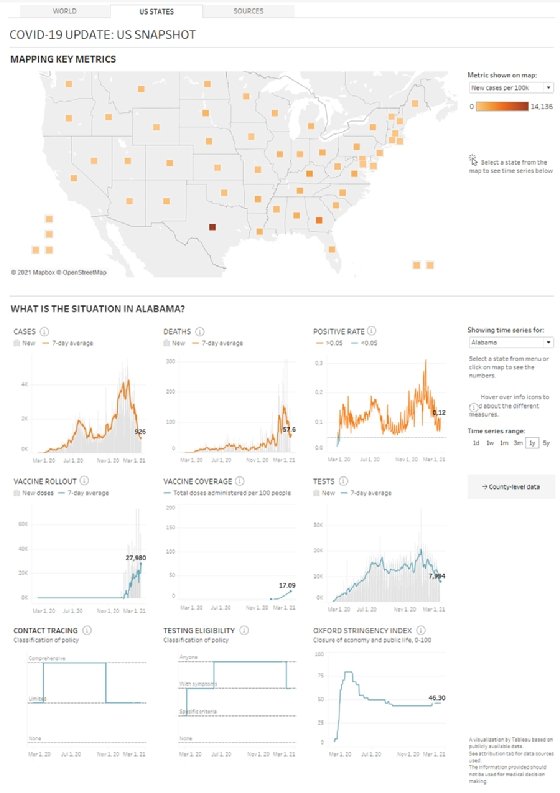
In a statistical or analytical context, it is the factual information derived from a measurement or research and can be represented as a numerical data point, a statistical display or a graph.
In simple terms, a data point could be a number, a word or even a physical object. The important thing is that it can be distinguished from other data points.
What are the requirements for a good data point?
There is no definitive answer to this question, as it depends on the context in which the data point is used. However, there are some general characteristics that are often considered to be important:
- Data points should be accurate and precise.
- They should be representative of the statistical population or phenomenon being studied.
- They should be free from bias.
- They should be timely.
- They should be easy to understand and use.
How are data points used?
Data points collected depends on the specific goal of research or a project.
Data points can be used to support or refute a hypothesis. They can be used to spot trends or patterns. And they can be used to make predictions. In short, data points are the building blocks of data analysis.
In a business setting, data points can be used to track customer behavior, measure the success of marketing campaigns and understand which products are selling well.
In a scientific setting, such points can be used to track the progress of an experiment or clinical trial, understand the behavior of a particular species or map the spread of disease.

How are data points measured or collected?
In all cases, data points can be collected manually or automatically. Manual data collection is often more time-consuming but can provide more accurate results.
Automated data collection is often less expensive but may be less reliable. The important thing is to choose the right option for the specific need.
What are some examples of data point collection methods?
There are many different ways to collect data points. Some common measurements include surveys, interviews, focus groups and observation.
In a business setting, such points can also be collected from customer transaction records, website logs and social media interactions.
In a scientific setting, data points can be collected from experiments, clinical trials and surveys.

How are data points analyzed?
Data point analysis can be performed using simple spreadsheet software, like Microsoft Excel files, or more advanced technology, such as business intelligence tools and other tracking software.
The most common methods of analysis include statistical analysis, graphical analysis and trend analysis.
Statistical analysis
Statistical analysis involves using mathematical techniques to analyze data sets. This type of analysis is often used to find relationships between different data points or to make predictions about future events.
Graphical analysis
Graphical analysis involves visualizing data points in a graph or chart. This type of analysis is often used to spot patterns.
Trend analysis
Trend analysis involves looking for patterns in data over time. This type of analysis is often used to make predictions about future events.
What are some examples of data points?
Here are a few examples of data points:
- number of hours of slept each night;
- amount of money spent each day;
- length of time it takes to complete a service;
- number of users on a web server at a particular time of day;
- number of people who visit a website page; and
- number of likes on a social media post.
Once a data point is analyzed, then what happens?
After a data point is analyzed, it can be used in a variety of ways, but most often, it is either to confirm a hypothesis as mentioned earlier or to track change over time as a way to support a future decision.
For example, data points can be used to help a business owner determine how best to invest further resources to support the business or, in a scientific setting, determine which treatment is most effective to combat a certain disease.
Data points can be simple or complex. People can track a single data point, or several at once, and data points can be measured quantitatively or qualitatively. They can be collected in a variety of ways as well.
See also: data, data scientist, big data, data classification, data mining, data context and survey research.