graph database

What is a graph database?
A graph database, also referred to as a semantic database, is a software application designed to store, query and modify network graphs. A network graph is a visual construct that consists of nodes and edges. Each node represents an entity, such as a person, and each edge represents a connection or relationship between two nodes.
Graph databases are a type of database design that has been around in some variation for a long time. As an example, a family tree is a simple graph database.
The concept behind graphing a database is often credited to 18th-century mathematician Leonhard Euler. The concept of using databases to map relationships digitally became popular in business around 2015 when increased compute power, in-memory computing and agreed-upon standards moved the concept from academics to real-world uses in business and enterprise computing.
Graph databases store and represent data in the form of nodes, edges and properties. Where nodes represent entities and edges represent the relationships between entities, properties are the attributes associated with nodes and edges that provide additional context. Nodes are stored as records, with edges and properties represented as pointers between nodes.
Graph databases are well suited for analyzing interconnections, which is why they're being used to mine data from social media. Graph databases are also useful for working with data in business disciplines that involve complex relationships and dynamic schema, such as supply chain management, identifying the source of an Internet Protocol telephony issue and creating "Customers who bought this also looked at ..." recommendation engines.
How do graph databases work?
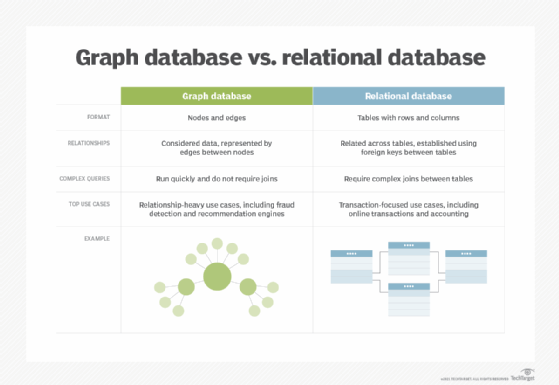
Graph databases are structured using a graph model -- different from traditional relational databases. Graph databases are unique in their structure, how they manage and store information, and how they're queried.
The structure of a graph database
Graph databases work using a graph model, which consists of nodes, edges and properties that form the graph structure. Nodes represent entities like people, places or things, and edges represent relationships between entities. Properties are the attributes -- stored as additional metadata -- associated with edges and nodes.
Traditionally classified as a type of NoSQL database, graph databases exist in several types, such as triple stores, for example. This type of database uses a special index that stores information about nodes, edges and the relationships between them in groups of three.
A triple, which is also referred to as an assertion, has three main fields: a subject, a predicate and an object. Each subject, predicate or object is represented by a unique resource identifier (URI).
How information is indexed
In a triple store, the first field in the database holds the URI for the subject, the second field holds the URI for the predicate, and the third field holds the URI for the object. While there are several strategies that graph databases can use for storing triples, most use an index that abbreviates the three primary fields to ?s, ?p and ?o.
For example, if the visual construct for a graph is given as follows:
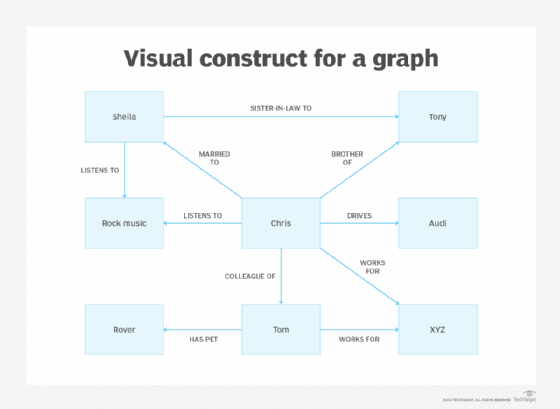
Then the index will look like this:
| Row | ?s | ?p | ?o |
| 1 | :Chris | :marriedTo | :Sheila |
| 2 | :Chris | :brotherOf | :Tony |
| 3 | :Chris | :listensTo | :RockMusic |
| 4 | :Sheila | :listensTo | :RockMusic |
| 5 | :Sheila | :sisterInLawTo | :Tony |
| 6 | :Tom | :worksFor | :XYZ |
| 7 | :Tom | :hasPet | :Rover |
| 8 | :Chris | :drives | :Audi |
| 9 | :Chris | :colleagueOf | :Tom |
| 10 | :Chris | :worksFor | :XYZ |
Nodes might also be stored in clusters. Clustering in graph databases is the process of identifying groups, also called communities, of nodes that show adjacent connections in a graph. These node clusters are closely related to each other, compared with nodes that aren't in the cluster.
How information in a graph database is queried
Graph algorithms are used to analyze the relationships of interconnected graph data. They perform tasks like finding patterns, shortest connected paths and distance between vertices, as well as the vertices' importance and clustering.
Graph query languages are programming languages used to interact with graph databases. They let users retrieve, manipulate and analyze graph data. Graph query languages have features that enable users to add, edit and query data, and can efficiently process complex queries. For example, the ISO/IEC 39075:2024 standard, published in April 2024, outlines data structures and basic operations on property graphs.
Each triple in a graph database only gets stored once in the index. Just like relational databases, it's a simple process to do a straight lookup query in a graph database. If the query is for what information is known about Chris, the indexer programming only needs to search rows 1-3 of the database.
The real power and speed of a graph database come from indexing combinations of triples. The following are a few examples:
- If the query is for who Chris is married to, the indexer will look for the predicate :marriedTo in rows 1-3 and then retrieve the matching object. Chris is married to Sheila.
- If the query is to identify everyone who listens to the same kind of music as Chris, the indexer will first ask { :Chris :listensTo ?o } and identify :RockMusic as the object.
In the second query, the results will return :RockMusic in rows 3 and 4. The subject in row 3 is Chris himself, so whoever is the subject in row 4 will be the other person who listens to rock music. It turns out to be Sheila, Chris' wife.
Types of graph databases
There are several usable types of graph databases, including the following:
- Knowledge graphs. Knowledge graphs like the one above focus on the semantic aspects of data and store information in triples.
- Property graphs. Property graphs support nodes, edges and model relationships among data points, with detailed information about the subject and how that data interrelates.
- Resource Description Framework graphs. RDF graphs express data in graphs using object, predicate and subject parts. They're used to manage interlinking resources and metadata, and conform to World Wide Web Consortium standards.
- Triple store. Triple store graph data models store data in the triple format consisting of a subject-predicate-object data structure. They're used for storage and querying of data, including semantic relationships.
- Hypergraph databases. Hypergraph models enable hyperedges, which are relationships that connect two or more nodes. They're used with graphs that have more complex many-to-many relationships.
Use cases for graph databases
Current use cases for graph databases include the following:
- Enabling data analysts to federate data sets without having to create and run complex queries that join combinations of tables together, as in the relational database model.
- Helping developers create the back end for voice assistants by mapping possible user questions to correct answers.
- Examining direct connections to identify potential indirect connections for recommendation engines.
- Detecting cases of fraud by quickly analyzing patterns and connections between entities such as users, accounts or transactions, for example. Anomalous behavior is identified by detecting unusual patterns in the graph.
- Modeling relationships between interactions on social media platforms, such as users, posts, comments and likes. This enables more efficient querying and analysis of social connections and more personalized social media features.
Future of graph databases
Graph database tools like Amazon Neptune and Neo4j are becoming increasingly available. In addition, they offer benefits such as enabling more flexible data modeling, efficient querying, real-time insights and simplified data integration. As such, it's becoming easier for developers to add graph analytics to existing applications while still maintaining data integrity, scalability and consistency.
Graph databases are expected to play an increased role in areas such as machine learning, Bayesian analysis, data science and artificial intelligence, as well as help to manage enterprise data and data interchange over the next decade.
Another potential impact on this type of database is improvements in data federation. When knowledge graphs can be easily federated, one database will be able to determine that it needs data it doesn't have and automatically retrieve that data from other knowledge graphs. With this ability, it's possible that federation can help developers create blockchains that use relevant metadata to authenticate transactions in banking, finance, voting and smart contracts.
Graph databases excel at creating data and analytics innovations. Learn more about Gartner's predictions for the future of graph databases.