What is descriptive analytics?
Descriptive analytics is a type of data analytics that looks at past data to give an account of what has happened. Results are typically presented in reports, dashboards, bar charts and other visualizations that are easily understood.
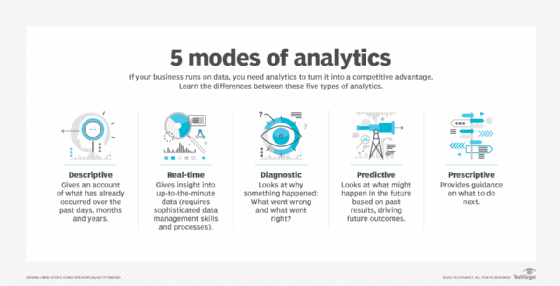
The field of data analytics is generally divided into four main types: descriptive analytics, diagnostic analytics, predictive analytics and prescriptive analytics. A fifth type, real-time analytics, analyzes data as it's generated, collected or updated.
Descriptive analytics is the simplest of these techniques. It can be used by itself or treated as a preliminary stage of data processing to create a summary or abstraction that, in turn, supports further investigation, analysis or actions performed by other types of analytics.
How does descriptive analytics work?
Descriptive analytics uses various statistical analysis techniques to slice and dice raw data into a form that enables people to see patterns, identify anomalies, improve planning and compare things. Enterprises realize the most value from descriptive analytics when using it to compare items over time or against each other. For example, a finance manager might compare product sales month over month or against related categories.
Descriptive analytics can work with numerical data, qualitative data or some combination of the two. Numerical data might quantify things like revenue, profit or a physical change. Qualitative data might characterize elements such as gender, ethnicity, profession or political party. To improve understanding, raw numerical data is often binned into ranges or categories such as age ranges, income brackets or zip codes.
Descriptive analysis techniques perform various mathematical calculations that make recognizing or communicating a pattern of interest easier. For example, central tendency describes what is normal for a given data set by considering characteristics such as the average, mean and median. Other elements include frequency, variation, ranking, range and deviation.
Real examples of descriptive analytics
Descriptive analytics is used in a variety of industries. Some real examples include the following:
- Financial statement analysis. Organizations use descriptive analytics to evaluate performance based on an analytical review of their data, such as income statements, balance sheets and cash flow reports. Gartner predicts that at least 90% of descriptive analytics done in finance will be fully automated by 2027.
- Retail sales reporting. Descriptive analytics is used by businesses to track sales data across different periods of time. This can give companies an insight into purchasing trends, product demand and seasonal variations.
- Healthcare records. Descriptive analytics is important in hospitals and other health clinics, as it enables healthcare providers to identify health conditions, treatment outcomes and resource utilization.
- Website traffic analytics. Digital marketers use descriptive analytics to track website visitor trends, bounce rates and engagement levels.
- Social media engagement analysis. Businesses use descriptive analytics to measure likes, shares, comments and follower growth, which can help them adjust content strategies and improve audience interaction.
Descriptive analytics is also commonly used for the following:
- Planning a new program.
- Measuring the effectiveness of a new program.
- Understanding sales trends.
- Comparing companies.
- Motivating behavior with KPIs.
- Recognizing anomalous behavior.
- Interpreting survey results.
What can descriptive analytics tell you?
Businesses use descriptive analytics to assess, compare, spot anomalies and identify relative strengths and weaknesses. Let's walk through how these might work in practice.
- Assess. Developing a description of the various aspects of business operations forms a baseline for a company and can be used to help assess behavior that improves or weakens outcomes. Important metrics include business performance (sales, costs and profits), website performance (click-through rate, conversion rate) and customer satisfaction (Net Promoter Score, customer satisfaction score and social media likes) or equipment performance (uptime, repair time and maintenance cost).
- Compare. Baseline metrics for a characteristic can be compared across time, categories, programs or interventions. Existing sales performance could be compared to last month's sales, to the same period a year ago or over a more extended range to understand historical trends. Similarly, teams might compare sales across product categories or compare one company's performance against a related company.
- Spot anomalies. Teasing apart descriptive statistics can sometimes reveal outliers worthy of further investigation. For example, descriptive analytics might show that sales in one region are significantly higher than others, or that a successful product line suddenly slumps. These anomalies could prompt additional research using diagnostic analytics to understand their root causes.
- Identify relative strengths and weaknesses. A company might discover, for example, that it tends to sell better to younger shoppers than to older ones. This insight might inspire efforts to double down on strengths, with more focused marketing or prompt action to address weaknesses in the area where sales are lagging.
Steps in descriptive analytics
The descriptive analytics process includes the following steps:
- Quantify goals. The process starts by translating some broad business goals, such as better business performance, into specific, measurable outcomes such as sales per product, cost per sale or conversion rate.
- Identify relevant data. Teams need to identify any types of data that could help improve the understanding of the critical metric. The data might be buried across one or more internal systems or within various third-party data sources.
- Organize data. Data from different sources, applications or teams needs to be cleaned and normalized to improve analytics accuracy.
- Analysis. Various statistical and mathematical techniques combine, summarize and compare the raw data in different ways to generate data features.
- Presentation. Data features might be numerically presented in a report, dashboard or visualization. Common visualization techniques include bar charts, pie charts, line charts, bubble charts and histograms.
Benefits and drawbacks of descriptive analytics
The use of descriptive analytics can provide the following benefits:
- It can simplify communication about numerical data.
- It can improve understanding of complex situations.
- Companies can compare performance against the competition or across product lines.
- It can help motivate teams to reach new goals.
Drawbacks and weaknesses of descriptive analytics include the following:
- Existing biases can be amplified either accidentally or deliberately.
- Results can direct a company's focus to metrics that are not helpful, such as sales versus profits.
- Motivational metrics can be gamed to encourage unintended behavior, such as mouse movers or sales fraud.
- Poorly chosen metrics can lead to a false sense of security.
Descriptive analytics tools
Relatively simple tools, like an Excel spreadsheet, and some knowledge of business management are enough to craft basic descriptive analytics. However, teams might see greater value across the organization by scaling various types of tools to democratize analytics development and promote the sharing of business intelligence (BI).
Business intelligence tools like Power BI, Tableau and Qlik can simplify many steps of the descriptive analytics process.
Descriptive analytics tools provide various ways for reorganizing raw data to view new patterns by calculating characteristics such as averages, frequencies, variations, rankings, ranges and deviations. While these basic techniques are baked into essential BI tools, a team might turn to more sophisticated data science tools for complex statistics, including the following:
- The R programming language.
- IBM's Statistical Package for the Social Sciences.
- Analytics software from SAS Institute Inc.
- Knime open source software.
- SQL.
- Python.
Data-wrangling tools can help automate data engineering processes by cleansing, reformatting and combining data from many different sources. Popular tools include offerings from Alteryx, Cambridge Semantics, Trifacta, Talend and Tamr.
Descriptive analytics vs. prescriptive, predictive and diagnostic analytics
As noted, the field of analytics is commonly characterized as including four main kinds of capabilities:
- Descriptive analytics, as explained, provides information about what happened. You might see, for example, an increase in sales following a new promotion.
- Diagnostic analytics examines data more closely to understand the causes of events and behaviors. For example, in the case of increased sales, you might investigate which categories of people showed the greatest response and why this might be the case.
- Predictive analytics identifies future probabilities and trends based on a model of past behavior. For example, once you have identified the root cause of that uptick in sales, predictive analytics could help calculate the likelihood and magnitude of a similar sales increase happening in other markets.
- Prescriptive analytics makes recommendations or automates decisions based on a given prediction. For example, prescriptive analytics could suggest the best ways to structure and implement a successful sales promotion in another region based on that region's local demographics.
Descriptive analytics vs real-time analytics
Descriptive analytics and real-time analytics are both critical methods of data analysis. While descriptive analytics focuses on analyzing past data to identify trends, patterns and insights, real-time analytics processes incoming data. Therefore, organizations use these separate methods to make different kinds of decisions.
Descriptive analytics, for instance, gives organizations insight into long-term customer behavior and trends, which makes it critical for research-based strategic planning. On the other hand, real-time analytics' continually updated data sets are best suited for immediate decisions, in which quick responses are needed. These include fraud detection, dynamic traffic management and live monitoring of financial transactions.
Jobs using descriptive analytics
Descriptive analytics is critical to a variety of jobs across industries. Some of the most commons jobs include the following:
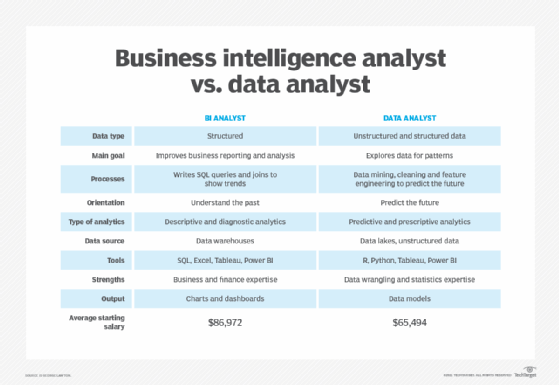
- Data analyst. Analyzes structured datasets to identify trends, patterns and KPIs, helping optimize business strategies.
- Business intelligence analyst. Uses data visualization and reporting tools to provide insights for executives and managers.
- Marketing analyst. Conducts research on customer behavior, campaign effectiveness and market trends using descriptive analytics.
- Financial analyst. Evaluates past financial performance using statistical methods to assess profitability, investment risks and budget planning.
- Healthcare data analyst. An increasingly important position that works with patient records and clinical data sets to improve healthcare services, operational efficiency and patient outcomes.
Descriptive analytics is an important method used in data analysis. Learn about nine types of bias in data analysis you should avoid. Further explore the differences of descriptive vs. prescriptive vs. predictive analytics.