What is SPSS (Statistical Package for the Social Sciences)?
SPSS (Statistical Package for the Social Sciences), also known as IBM SPSS Statistics since 2009, is a user-friendly software package used for the analysis of statistical data and to make data-driven decisions.
IBM SPSS is a statistical application that enables business users to simplify data analysis, capture useful insights from data and use those insights for a wide range of use cases. It features an intuitive interface with drag-and-drop functionality; it includes features to integrate data management with statistical analysis, visualize missing data patterns, summarize variable distributions and create customizable analysis outputs and reports. The program's fast-visual modeling environment includes predictive modeling capabilities and supports models for many different use cases:
- Customer behavior predictions.
- Market trends forecasting.
- Market research.
- Data mining.
- Surveys.
- Regulatory compliance.
- Risk management.
Key features of IBM SPSS
SPSS provides data analysis capabilities for descriptive and bivariate statistics, categorical outcome predictions and advanced statistical techniques like linear regression, survival analysis, and two-stage least-squares regression. It also provides features to help users do the following:
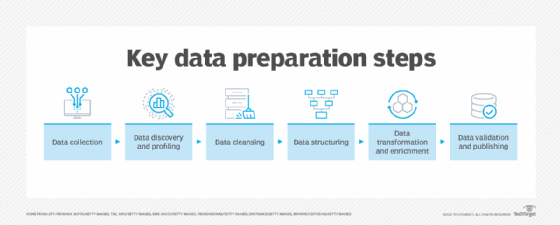
- Streamline data preparation.
- Estimate the sampling distributions of estimators.
- Design and share interactive tables.
- Analyze complex relationships to reach more accurate conclusions.
- Transform data into visualizations to efficiently formulate hypotheses and make accurate predictions.
- Summarize data in different styles to suit the needs of different audiences.
- Build time-series forecasts.

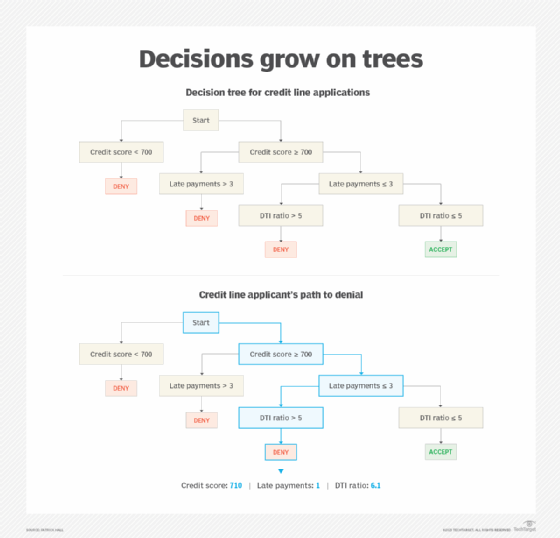
SPSS also includes decision trees to identify groups and relationships as well as predict outcomesl; neural networks to discover complex relationships; and features to enhance direct marketing, perform complex sampling, measure purchasing decisions, uncover missing data patterns and reveal relationships using categorical data.
The software interface displays data similarly to a spreadsheet in its main view. With its secondary variable view, the metadata that describes the variables and data entries present in the data file is displayed.

IBM SPSS Categories
Categories is a feature in IBM SPSS that enables users to use categorical data to reveal relationships among data points and predict outcomes based on the findings. Available for testing and with a full-feature SPSS trial, Categories uses categorical regression procedures to predict the values of outcome variables from predictor variables. The Categories module is also included in the SPSS Statistics Professional Edition (on-premises) and with the subscription-based Complex Sampling and Testing add-on.
In addition to analyzing and interpreting multivariate categorical data, users can use optimal scaling techniques like correspondence analysis, categorical regression, nonlinear canonical correlation, proximity scaling and preference scaling to make predictions for a wide range of use cases. Optimal scaling is particularly useful for numeric variables with non-normal residuals and for applications where predictor variables are not linearly related with the outcome variable.
Other advanced techniques included in SPSS Categories are the following:
- Predictive analysis.
- Statistical learning.
- Perceptual mapping.
- Symmetrical normalization.
IBM SPSS benefits
The advanced statistical procedures supported by SPSS enable users to perform detailed analyses on their valuable data assets and improve research outcomes. They can also analyze complex relationships to reach more accurate conclusions and use the reliable insights generated by the software to make better decisions.
Users at any experience level or technical proficiency -- beginners, experienced statisticians and business professionals -- can use the software's visual data science tools and features. The application's user-friendly interface makes it easy to prepare and analyze data without having to write code. Also, the data can be summarized in different formats for different audiences, increasing its usability and viewer's comprehension.
Furthermore, for a variety of industries, using SPSS and its many analytical capabilities can garner many benefits:
- Effective risk management.
- Reduced costs.
- Prediction and minimization of the frequency of operational failures.
- Optimized uptime and decreased downtime.
- Achievement and maintenance of regulatory compliance.
- Increased efficiency, profitability and ROI.
IBM SPSS use cases
Although IBM renamed SPSS to IBM SPSS Statistics in 2009, it is still commonly referred to as just SPSS. Despite the product name reflecting its original use for the analysis of social sciences data, over the years, its use has expanded into other data markets, including healthcare, marketing, retail and education research.
In healthcare, SPSS and its univariate and multivariate data modeling techniques are used to analyze patient data to modernize care delivery practices, design incentives for caregivers, identify opportunities for reducing costs and to drive better outcomes for patients. For marketing use cases, SPSS provides actionable insights from customer data, allowing marketing teams to analyze market and product trends, prepare forecasts, test marketing campaigns, improve campaign results, create predictive models and make better decisions. SPSS is also useful in education, helping educational institutions and educators identify students at high risk of failure and then implement plans to reduce the risk and provide remediation.
There are many use cases for SPSS in the retail industry:
- Stock planning.
- Trend forecasting.
- Customer experience management.
- Customer segment analysis.
- Customer profiling.

IBM SPSS editions
There are three editions of IBM SPSS Statistics:
- Commercial Edition for companies and researchers.
- Campus Edition for educational institutions and educators.
- GradPack and Faculty Packs for students.
The Commercial Edition includes a Base Edition that provides capabilities for descriptive statistics, linear regression, and visual graphing and reporting. It also includes advanced data preparation capabilities to eliminate labor-intensive manual tasks. A perpetual or term license for the Base Edition costs $8,440 per user. Many of these capabilities can be extended with the R programming language or Python.
The Standard Edition includes all the Base Edition capabilities plus advanced modelling options, custom tables and regression analysis features. A perpetual or term license for the Standard Edition costs $8,440 per user.
SPSS Commercial is also available in a Professional Edition ($16,900 per user) with advanced statistical procedures that both novice and experienced users can use to develop reliable forecasts, predict outcomes and drive more valid conclusions. A Premium Edition that includes advanced analytical techniques and additional features like neural networks and direct marketing. A perpetual or term license for the Premium Edition costs $25,200 per user.
The SPSS Statistics Campus Edition includes features that enable academic institutions to use the solution for both teaching and learning purposes. An unlimited number of users can use a single license without having to worry about licensing administration or user lockout.
The SPSS Statistics GradPack and Faculty Pack are both single-use licenses for students and teachers, respectively. GradPack is available in Base, Standard and Premium editions, while the Teacher Faculty Pack is the Premium Pack. Advanced features like missing values, categories, forecasting, decision trees, neural networks and digital marketing are only available in GradPack Premium for students and Faculty Pack for teachers. Pricing for the GradPack and Faculty Pack depends on the vendor.
Data sources for IBM SPSS
SPSS can use a wide variety of data types for data analysis. Common sources include survey results, organization customer databases, Google Analytics, scientific research results and server log files. SPSS supports both analysis and modification of many kinds of data and almost all formats of structured data. The software supports spreadsheets, plain text files, relational databases such as SQL, and data stored in SATA and SAS resources.
Learn about the difference between data science vs. machine learning, and explore common data science techniques to know and use. Read about the future of data science, including career outlook and industry trends. Check out data science skills for machine learning and AI.
