Markov model
What is a Markov model?
A Markov model is a stochastic method for randomly changing systems that possess the Markov property. This means that, at any given time, the next state is only dependent on the current state and is independent of anything in the past. Two commonly applied types of Markov model are used when the system being represented is autonomous -- that is, when the system isn't influenced by an external agent. These are as follows:
- Markov chains. These are the simplest type of Markov model and are used to represent systems where all states are observable. Markov chains show all possible states, and between states, they show the transition rate, which is the probability of moving from one state to another per unit of time. Applications of this type of model include prediction of market crashes, speech recognition and search engine algorithms.
- Hidden Markov models. These are used to represent systems with some unobservable states. In addition to showing states and transition rates, hidden Markov models also represent observations and observation likelihoods for each state. Hidden Markov models are used for a range of applications, including thermodynamics, finance and pattern recognition.
Another two commonly applied types of Markov model are used when the system being represented is controlled -- that is, when the system is influenced by a decision-making agent. These are as follows:
- Markov decision processes. These are used to model decision-making in discrete, stochastic, sequential environments. In these processes, an agent makes decisions based on reliable information. These models are applied to problems in artificial intelligence (AI), economics and behavioral sciences.
- Partially observable Markov decision processes. These are used in cases like Markov decision processes but with the assumption that the agent doesn't always have reliable information. Applications of these models include robotics, where it isn't always possible to know the location. Another application is machine maintenance, where reliable information on machine parts can't be obtained because it's too costly to shut down the machine to get the information.
How is Markov analysis applied?
Markov analysis is a probabilistic technique that uses Markov models to predict the future behavior of some variable based on the current state. Markov analysis is used in many domains, including the following:
- Markov chains are used for several business applications, including predicting customer brand switching for marketing, predicting how long people will remain in their jobs for human resources, predicting time to failure of a machine in manufacturing, and forecasting the future price of a stock in finance.
- Markov analysis is also used in natural language processing (NLP) and in machine learning. For NLP, a Markov chain can be used to generate a sequence of words that form a complete sentence, or a hidden Markov model can be used for named-entity recognition and tagging parts of speech. For machine learning, Markov decision processes are used to represent reward in reinforcement learning.
- A recent example of the use of Markov analysis in healthcare was in Kuwait. A continuous-time Markov chain model was used to determine the optimal timing and duration of a full COVID-19 lockdown in the country, minimizing both new infections and hospitalizations. The model suggested that a 90-day lockdown beginning 10 days before the epidemic peak was optimal.
How are Markov models represented?
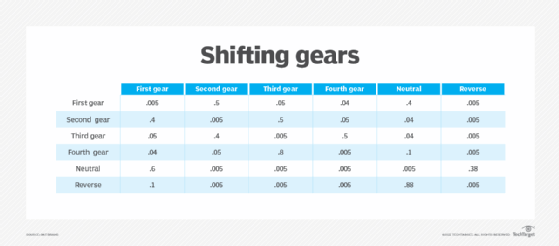
The simplest Markov model is a Markov chain, which can be expressed in equations, as a transition matrix or as a graph. A transition matrix is used to indicate the probability of moving from each state to each other state. Generally, the current states are listed in rows, and the next states are represented as columns. Each cell then contains the probability of moving from the current state to the next state. For any given row, all the cell values must then add up to one.
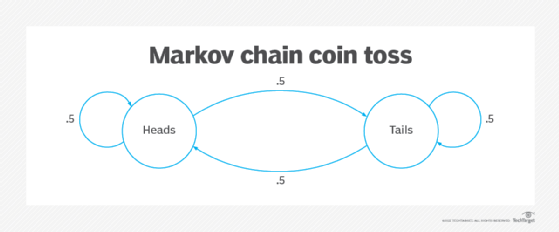
A graph consists of circles, each of which represents a state, and directional arrows to indicate possible transitions between states. The directional arrows are labeled with the transition probability. The transition probabilities on the directional arrows coming out of any given circle must add up to one.
Other Markov models are based on the chain representations but with added information, such as observations and observation likelihoods.
The transition matrix below represents shifting gears in a car with a manual transmission. Six states are possible, and a transition from any given state to any other state depends only on the current state -- that is, where the car goes from second gear isn't influenced by where it was before second gear. Such a transition matrix might be built from empirical observations that show, for example, that the most probable transitions from first gear are to second or neutral.

The image below represents the toss of a coin. Two states are possible: heads and tails. The transition from heads to heads or heads to tails is equally probable (.5) and is independent of all preceding coin tosses.

History of the Markov chain
Markov chains are named after their creator, Andrey Andreyevich Markov, a Russian mathematician who founded a new branch of probability theory around stochastic processes in the early 1900s. Markov was greatly influenced by his teacher and mentor, Pafnuty Chebyshev, whose work also broke new ground in probability theory.
Learn how organizations are using a combination of predictive analytics and AI to make decisions based on past behaviors.
