Using Microsoft PerfView to profile process performance data
Microsoft made its internal performance monitoring tool available to the public. Here's how it offers an advanced peek at application processes.
How do you profile an application's process performance data? How is it spending its time (what functions are being called) and is it doing its work efficiently?
PerfView, released recently by Microsoft, has the ability to collect Event Tracing for Windows (ETW) data to trace the call flow of processes identifying the frequency with which functions are called. Until now, this tool has only been used internally within Microsoft by developers responsible for ensuring optimal performance with components of the operating system.
In addition to profiling process performance data (something tools like Perfmon, PAL and xperf can't easily do), PerfView also has the ability to analyze process memory heaps to help determine if memory is being used efficiently. It also has a Diff capability that allows you to determine any differences between traces to help spot any regressions. Finally, the tool has a Dump capability to generate a process memory dump.
Installing PerfView
Version 1.0 of the product includes a zip file with just one executable file, perfview.exe, making installation easy. You can copy the file to the various servers that you want to trace and then analyze the data there or on your local workstation. PerfView is supported on Windows Vista, Windows 7, Windows Server 2008 and Windows Server 2008 R2.
Collecting Profile Data
PerfView leverages Event Tracing for Windows, which has been built into the operating system since Windows 2000 Server. Only recently have tools such as XPerf and PerfView taken advantage of ETW data for troubleshooting performance problems.
Event data is collected into an event trace log (ETL). Depending on the number of events you want to trace and the length of time, the size of the ETL file can become quite large. You can limit the size of the log files and make them circular if space is limited or you don’t know when the problem will occur. The default sampling interval of once-every-millisecond produces a CPU overhead of approximately 10% during the collection time frame. Approximately 5000 samples (5 seconds) are recommended for a representative profile sampling.
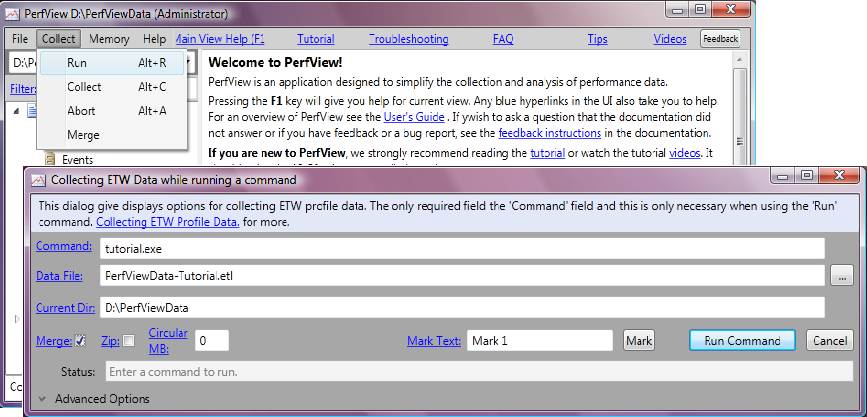
There are two ways to start a data collection; with the Run command to launch a single process, or with the Collect command to gather data machine-wide. These commands can be initiated from the GUI under the Collect pull-down menu, or from the CLI or a script by executing the “PerfView run” or “PerfView collect” commands. Figure 1 illustrates collecting data while running the command tutorial.exe, one of the built-in training exercises.
Figure 1: PerfView collect in action

Viewing the Results
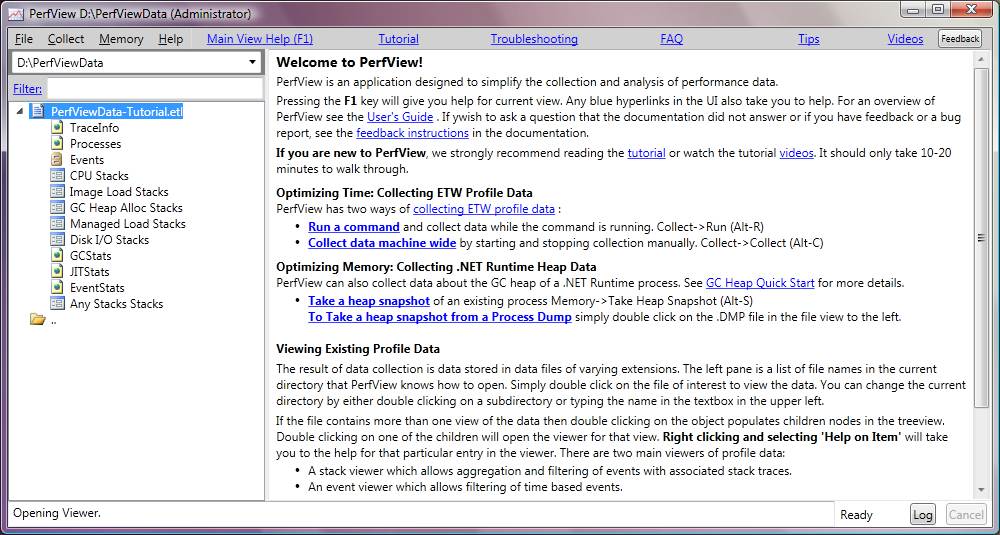
Once you have collected data during the time period for the performance issue, you can analyze the ETL file with PerfView. The ETL file will appear in the lefthand pane with the name you provided during the collection dialog or run command. By double-clicking the ETL file, about a dozen individual leaf nodes will appear with names indicating their contents. For example, you will see TraceInfo, Processes, Events, CPU Stacks, etc. as seen in Figure 2. By double-clicking each node, an appropriate viewer will reveal the contents.
Figure 2: PerfView data results

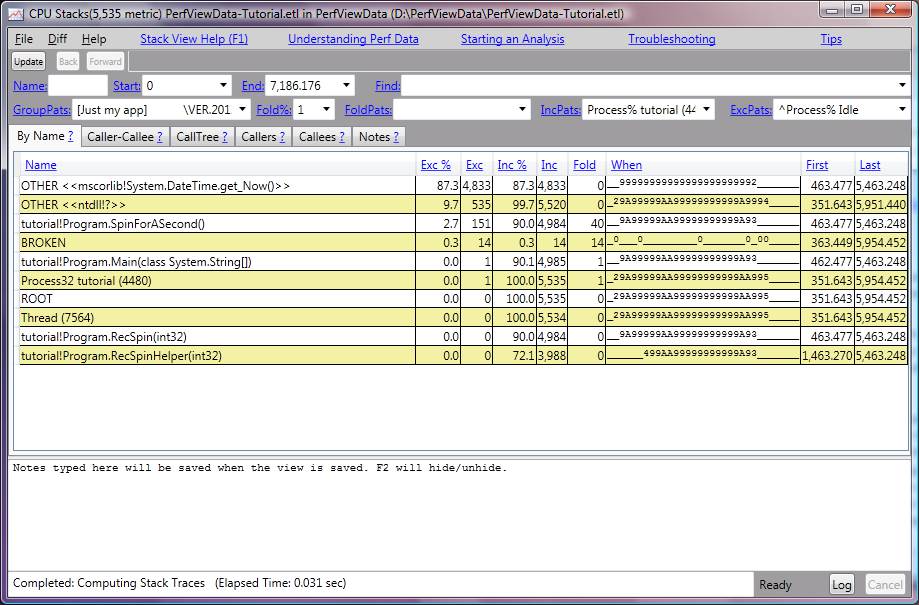
To analyze a compute-bound performance issue for a particular process, you will need to study the stacks or functions that were called. This can be accomplished by double-clicking the “CPU Stacks” node in the lefthand pane. You will then be prompted to select the process you are interested in. Finally, the CPU Stacks viewer will be launched in a separate window allowing you to determine which functions were called and their frequency as seen in Figure 3.
Figure 3: The CPU Stacks viewer

As you can see in the example, the function System.DateTime.get_Now() is executing 87% of the time. Therefore, to get the biggest bang for the buck, you would want to focus on optimizing either the number of times this module is called, or optimize the code within the module. While this is a trivial example, the tool can help you to identify misbehaving applications and where they are wasting time.
More on server performance monitoring tools:
Xperf tutorial: New ways to monitor Windows performance
What to look for when conducting benchmark tests with Perfmon
If you look closely at the example above, you can see how the second line shows OTHER <<ntdll!?>>. The “!?” indicates that PerfView was unable to resolve the module name. You can right-click the unknown module name and select “Lookup Symbols” to reveal the module names. It may be necessary to configure the Symbol Path as described in the User’s Guide to resolve operating system function names.
PerfView is a user-friendly tool that can be used to collect and analyze ETW data for profiling process performance data issues. The tool can quickly reveal the operating system functions that are being executed on behalf of the process, gaining insight to where performance problems may be lurking.
ABOUT THE AUTHOR
Bruce Mackenzie-Low, MCSE/MCSA, is a master consultant at HP providing 3rd level worldwide support on Microsoft Windows based products including Clusters and Crash Dump Analysis. With over 25 years of computing experience at Digital, Compaq and HP, Bruce is a well known resource for resolving highly complex problems involving clusters, SAN’s, networking and internals. He has taught extensively throughout his career always leaving his audience energized with his enthusiasm for technology.


