Extracting data from memory dumps with Event Tracing for Windows
Admins facing Windows Server frequent hangs and crashes can use a number of tools, like Event Tracing for Windows, to catch a badly behaving task.
Troubleshooting Windows Server hangs might be one of the toughest challenges a system administrator faces. When a server starts to hang, things can quickly go from bad to worse. Often, it is too late to set up counter logs to diagnose the problem in Microsoft's Performance Monitor, more commonly referred to as Perfmon, or to use Task Manager to catch the culprit in the act. The server seems to freeze without any sign of what caused the problem, and you hit the reset button praying it will reboot.
Sound familiar?
What if, just like an airplane's flight recorder, also known as the black box, you could replay the last few seconds of the server's performance just prior to the lock-up?
This article describes how to use two of my favorite troubleshooting techniques, namely crash dump analysis and Event Tracing for Windows (ETW), to determine what caused your server to hang.
We will assume you have already installed the Windows debugger and set up your server for a manually initiated crash dump as described in this article.
Event Trace Sessions
The secret is the built-in Event Trace Sessions that Windows has provided since Vista and Windows Server 2008. One of these trace sessions is known as the Circular Kernel Context Logger, or CKCL for short. It provides a 2 MB circular buffer that continually tracks kernel performance statistics in memory.
It is possible to extract this buffer from a forced memory dump and reveal the last few seconds of kernel activity. Extracting the buffer extends the usefulness of a crash dump and provides a snapshot of the server at the time of the hang that includes a history of the last few seconds.
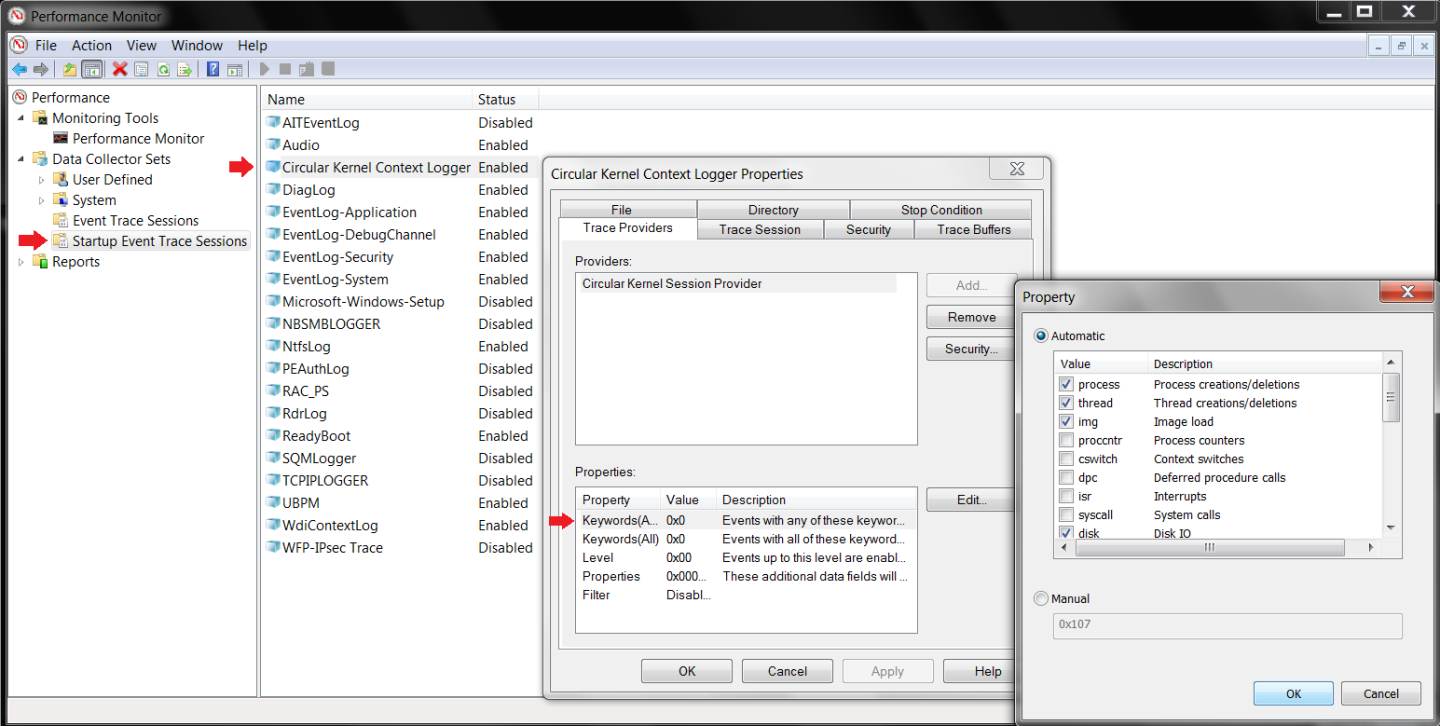
To enable the CKCL, you must select the kernel providers you want included in your trace. This can be accomplished by starting Computer Management or Perfmon to display Data Collector Sets, as seen below in Figure 1. You will then find Startup Event Trace Sessions, which lists the built-in event trace sessions, including the CKCL.
Next, you need to display the properties for the CKCL trace session by double-clicking it or right-clicking to select properties. On the Trace Providers tab, highlight the property called Keywords(Any) and click Edit… to select the providers you want to trace (e.g., process, thread, file).

Finally, on the Trace Session tab, select the Enabled checkbox.
Once you acknowledge the changes, you can right-click the CKCL trace session to select Start As Event Trace Session. This will start the CKCL trace session and list it under Event Trace Sessions, along with the other built-in sessions, all of which show a status of Running.
To automate the process of enabling and starting the CKCL after a reboot, you can use the following example Logman command in a script with the Task Scheduler. Use the Task Scheduler's Actions tab to specify the script and the Triggers tab to specify on startup:
Logman start "Circular Kernel Context Logger" –p "Circular Kernel Session Provider" (process,thread,img,file,driver) -ets
That's it. All you need to do now is sit back and wait for the next hang to occur. When it does, use the appropriate keystroke combinations (right Ctrl+ScrollLock twice) or NMI mechanism to manually force a system memory dump. Once the system reboots, you will be able to use the Windows debugger to analyze the memory dump.
Extracting performance data from memory dumps
The magical debugger extension that allows you to extract the Event Tracing for Windows performance data from the dump is called !wmitrace. There are two commands you'll need to know:

!wmitrace.strdump
!wmitrace.logsave [logger ID] [save location].etl
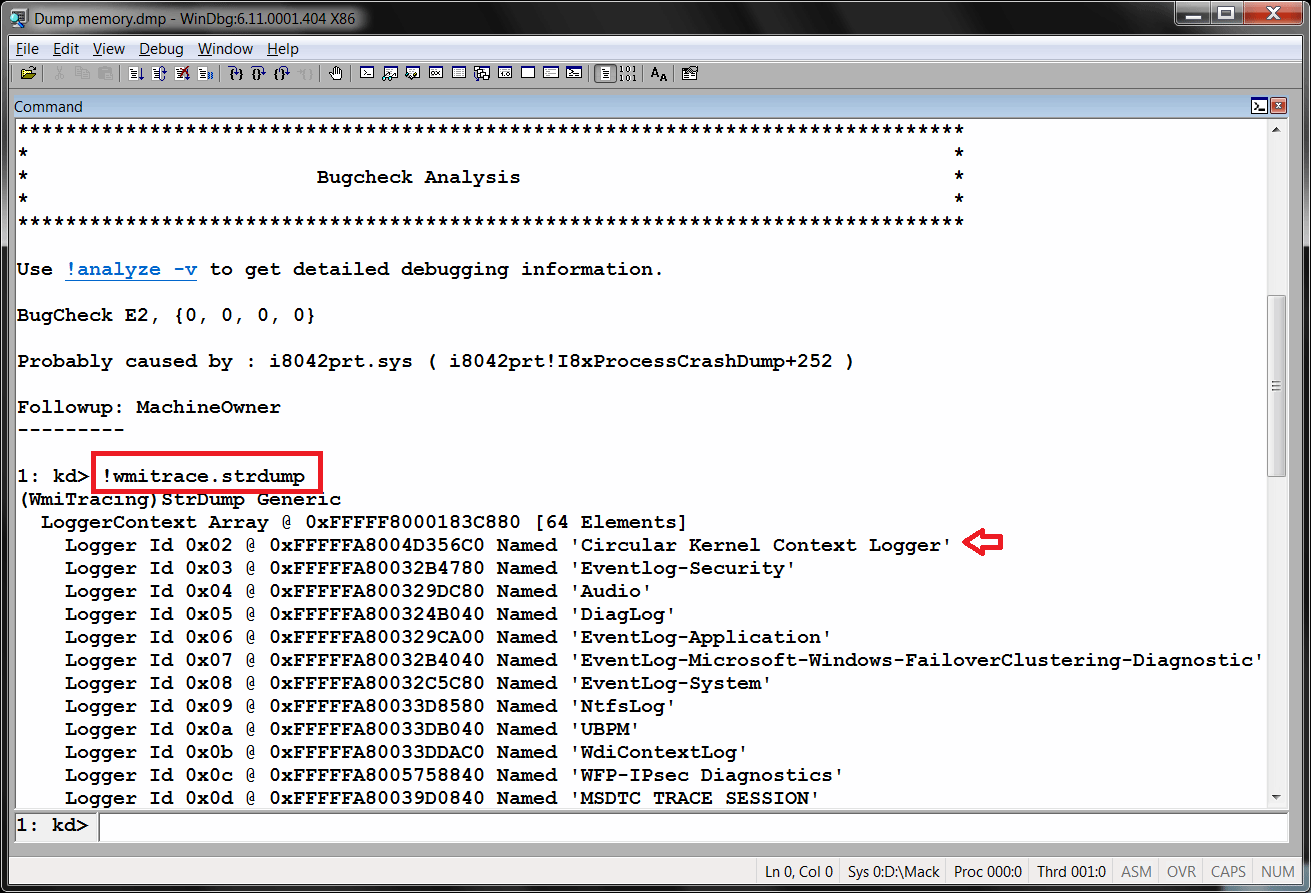
The first command, !wmitrace.strdump, is used to display all of the Event Trace Sessions running at the time of the forced memory dump. You will see the Circular Kernel Context Logger in addition to several others, each containing a "logger ID" to distinguish it from the rest. As you can see in Figure 2, the !wmitrace.strdump command reveals the CKCL has a logger ID of 0x02.

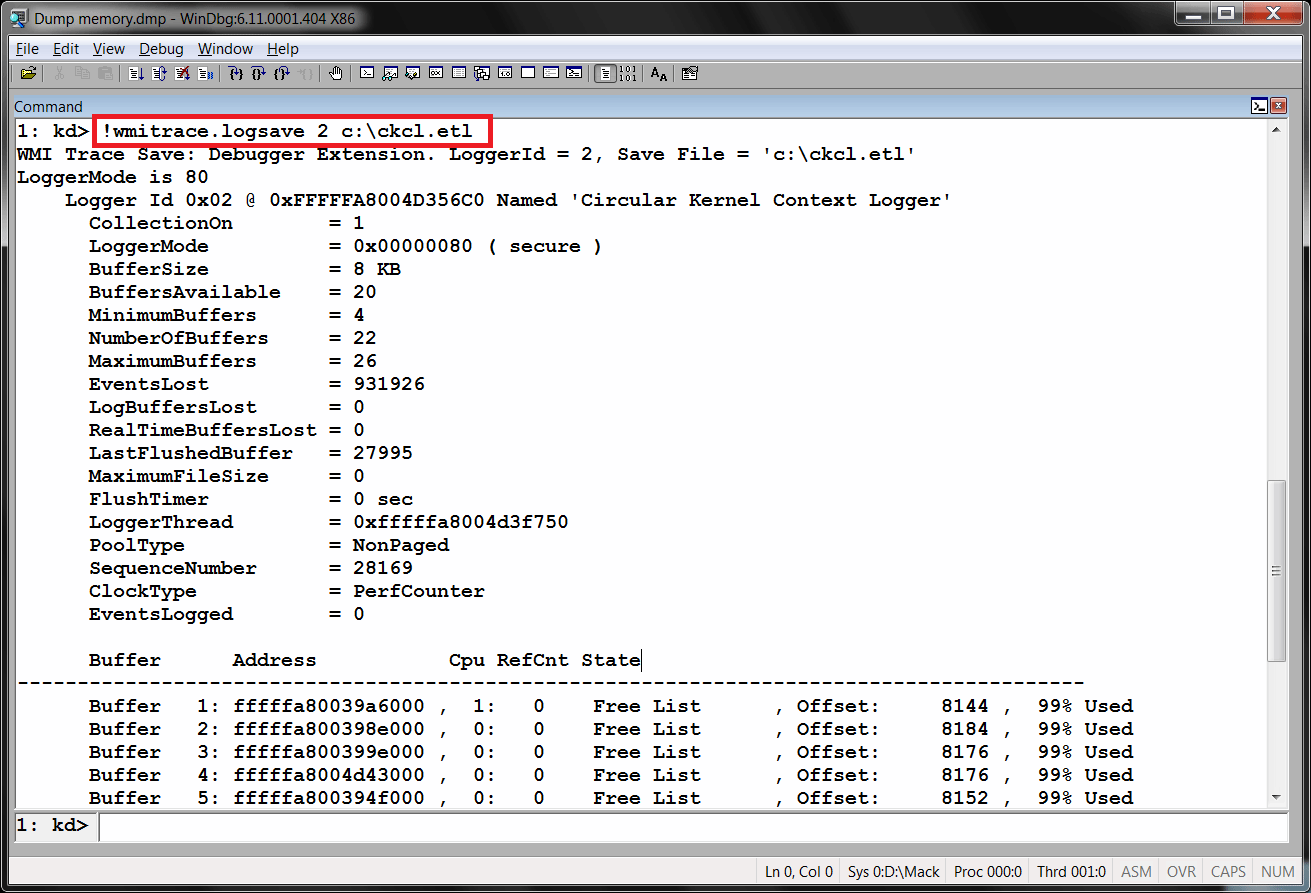
The command !wmitrace.logsave is then used to extract the ETW performance data from the specified session. In our example, the appropriate command to extract the CKCL buffers into an event trace log (ETL) file would be, as seen in Figure 3:
!wmitrace.logsave 2 c:\ckcl.etl
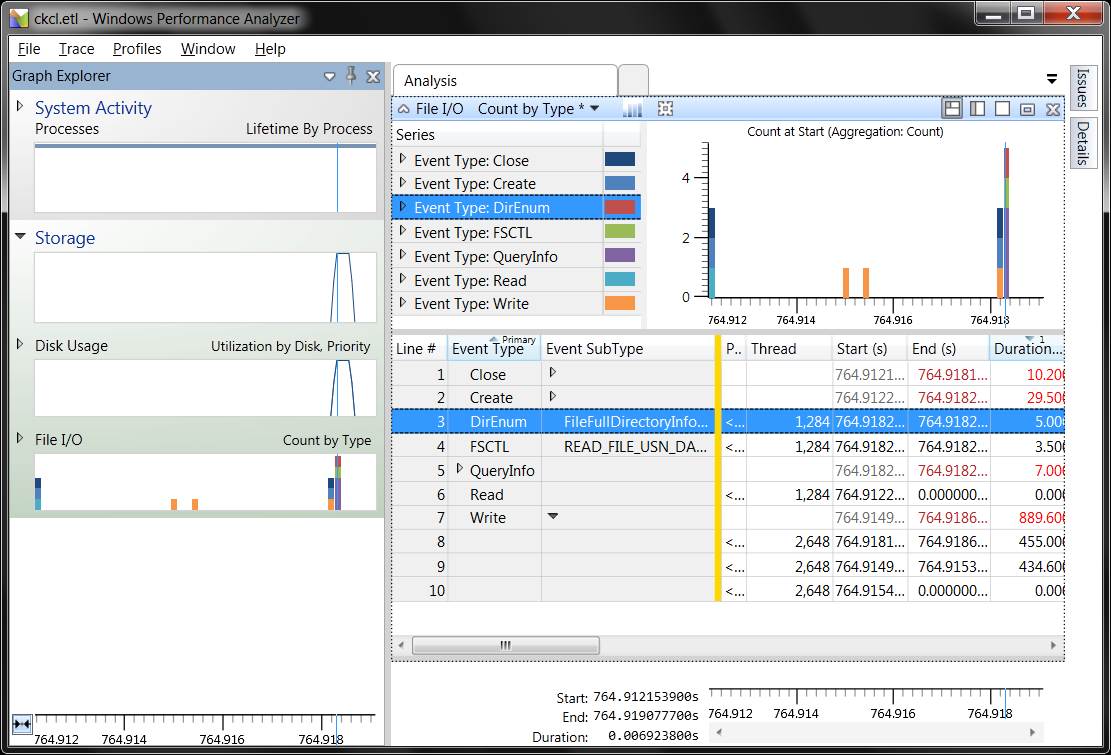
Once the performance data has been extracted, you can immediately leverage the Windows Performance Analyzer (WPA) or XPerf to study the data. As you can see below in Figure 4, WPA reveals potential disk and file utilization issues right before the hang:

Summary
Figuring out what caused a Windows server to hang can be a daunting task. But with the right tools and techniques, you can leverage ETW and the Windows Debugger to extract kernel performance data from system memory dumps. You can then use WPA or XPerf to analyze the performance data to determine what led up to the server hang. Keep in mind that while this article uses the CKCL trace session in the examples, you can create your own ETW trace session with WPR or XPerf specifying additional providers and logging options.
ABOUT THE AUTHOR
Bruce Mackenzie-Low, MCSE/MCSA, is a master consultant at HP providing third- level worldwide support on Microsoft-Windows-based products, including Clusters, Performance and Crash Dump Analysis. With over 25 years of computing experience at Digital, Compaq and HP, Bruce is a well-known resource for resolving highly complex problems. He has taught extensively throughout his career, always leaving his audience energized with his enthusiasm for technology.


