Determining the cause of Windows server hang
Using the Windows Kernel Debugger (Windbg), learn to fix Windows server hang by analyzing a forced crash dump to determine the cause of the hung server.
Part 1 | Part 2 | Part 3
Previously in this series, we talked about why Windows server hangs occur and how to prepare to resolve the problem using a tool called the Windows Kernel Debugger, or Windbg. In this article, we'll finish up by learning how to analyze the crash dump and fixing the issue.
After you have captured a forced crash dump, you are ready to begin using Windbg to determine what caused the hang. The following sections will explore the appropriate Windbg commands to use depending on the type of hang.
You can invoke Windbg two ways. One way is from the Windows Start menu:
Start | All Programs | Debugging Tools for Windows | Windbg
The other is from the DOS command prompt:
C:\ > windbg
In Windbg, use the File pulldown menu to select Open Crash Dump, specifying the location of the dumpfile. This can be accomplished in one step from the command prompt by using the –z option:
C:\> windbg –z memory.dmp
Be sure to watch out for any warnings from Windbg indicating a truncated or inconsistent set-bit count. Messages like this may indicate the dumpfile is corrupt or missing data:
WARNING: Dump file has been truncated. Data may be missing.WARNING: Dump file has inconsistent set-bit count. Data may be missing.
| ******************************************************************************** |
| ******************************************************************************** |
| ******************************************************************************** |
Windbg does a good job of pointing out problems with asterisks (*), so be sure to pay particular attention whenever you see them in the output. By default, the debugger output is displayed in the main window with a one-line command prompt at the bottom.
No matter what sort of hang your server has encountered, the first command that should be used in Windbg is this:
!analyze –v -hang
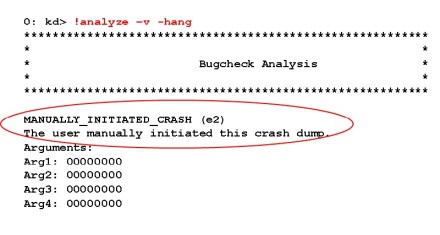
The !analyze command will perform a preliminary analysis of the dump and provide a "best guess" for what caused the crash. In the case of a forced dump, the analysis will typically point to the i8042prt.sys or kbdhid.sys driver because that is the driver that initiated the crash. You will also notice the bugcheck type is a 0xE2, indicating a manually initiated crash as seen in Figure 1.
In addition to providing a best guess for the cause of the crash, the !analyze command will also check for blocking locks and set the processor, process, thread and register context to the current ones at the time of the crash. Subsequent commands will use this context for their execution.
Once you have executed the !analyze command, the commands in Table 1 will help determine the footprint or circumstances that existed when the crash was forced. Be sure to focus on the current process, current thread, stack trace, virtual and physical memory usage, and locking information. We will take a closer look at these commands in subsequent sections.
Windbg commands for analyzing server hangs.
| Command | Description |
| !process | Display current process information |
| !thread | Display current thread information |
| !running –it | Display currently executing threads on all CPUs |
| !vm | Display virtual memory usage |
| !poolused | Display paged and non-paged pool usage |
| !memusage | Display physical memory usage |
| !locks | Display kernel locks held |
| !stacks | Display summary of threads, states and function |
| kv | Display current threads stack trace |
High-priority compute-bound threads
Identifying the current process (!process) and the current thread (!thread) can prove useful if the server hung because of a high-priority runaway, compute-bound thread. Use the !running –it command, as it will list all the currently executing threads across all the processors. Processes and threads can be assigned various levels of priorities that can preempt other processes and threads.
System resource depletion
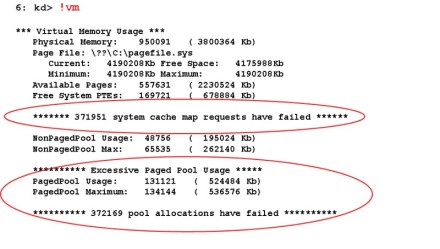
If you suspect a system resource depletion caused the hang, use the !vm, !poolused and !memusage commands. These commands display the virtual and physical memory usage at the time of the hang. Be sure to watch for any asterisks flagged by Windbg as illustrated in Figure 2.
To determine if paged pool or non-paged pool has been depleted, compare the "usage" to the "maximum" value as circled in red above. If the usage is relatively close to the maximum value, then there is a high likelihood that pool depletion caused the hang. You would then use the !poolused command to focus in on which pool data structure was responsible. The !poolused command has several flags to sort the paged or non-paged data structures according to their usage (see the online debugger help for more information on the command syntax and usage).
It is worth mentioning that pool statistics can also be acquired by several tools without the need for a memory dump. You can use Perfmon to collect general paged and non-paged performance statistics. Poolmon and Poolsnap are free tools from Microsoft that capture more granular specifics on the actual pool data structures. Finally, note that it is possible to tune paged pool on x86 servers by tweaking two registry values (PagedPoolSize and PoolUsageMaximum). For further details on tuning paged pool, check out Microsoft KB article 312362.
Deadlock and spinlock hangs
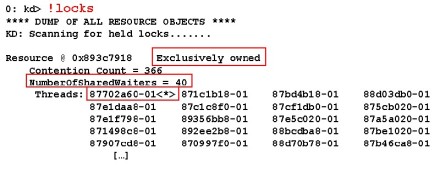
Use the !locks command if you suspect a deadlock hang. As explained earlier, a deadlock exists when one thread owns an exclusive lock on a resource that another thread wants, and that thread exclusively owns a resource that the initial thread wants. There are several variants of a deadlock scenario, but there must be waiter threads that stall as a result. In Figure 3, you can see a potential deadlock scenario where we have an exclusively owned lock on a resource that has numerous waiters.
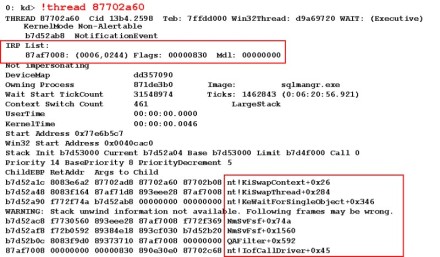
You will notice under the list of threads for the resource that one has an asterisk next to it. This thread is the one that owns the exclusive lock for the resource. So, the question to be answered is, what is causing the owning thread to stall and not release the lock for the other waiters to acquire? Therefore, the next command to issue would be a !thread command on the owning thread to determine why it is stalled.
Figure 4 shows the output of a !thread command on the owner. It reveals that it is stalled waiting for an I/O request packet (IRP) to complete from the QAFilter.sys driver. This particular case is a known issue caused by a deadlock with the QAFilter driver documented in Microsoft KB article 906194. Note that QAFilter and NmSvFsf are not standard Microsoft drivers, so symbols are not available for them from the Microsoft symbol server.
A spinlock hang is very similar to a deadlock condition except that processors are involved instead of threads. A data structure called a spinlock is used to synchronize access to other data structures or a critical section. Only one processor can own a particular spinlock at a time. The other processors that want to acquire the spinlock will wait (or spin) until the spinlock is released. In a spinlock scenario, multiple processors all want to acquire the same spinlock at an elevated IRQL, causing a perceived system hang.
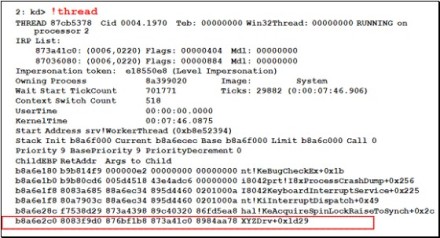
To troubleshoot a spinlock hang, examine each processor to determine what function is executing at the time. Use the ~# command -- where # is the processor number (0, 1, 2 …) -- to change context between processors. You will notice that the debugger's kd prompt changes to reflect the processor number that currently has context.
Then use the !thread or kv command to determine the stack trace of the current thread to see what function was executing. In a true spinlock scenario, all processors except one will be executing a spinlock acquire function. Finally, to determine the culprit (driver) responsible for the spinlock condition, look down the stack trace for the last driver to call the spinlock acquire function. See Figure 5 for an example of a stack trace illustrating a spinlock hang initiated by the XYZDrv.sys driver.
Finally, the command !stacks is very useful to determine which threads are executing and the states of those threads (running, ready, blocked, etc.). In the example of the spinlock hang, !stacks was extremely useful in illustrating how threads currently running on the various processors were all trying to acquire spinlocks except for the current thread that was executing the bugcheck code. Figure 6 shows an example of the !stacks command and the pertinent output.
And there you have it. Troubleshooting non-responsive Windows servers can be very perplexing. Fortunately, the Windows operating system has matured over the years and now offers a variety of features and tools to help determine what causes servers to hang. By forcing a crash dump and using Windbg to analyze it, you can typically isolate the hang to a particular application or system resource. Plus, if the problem requires further analysis from Microsoft, you will have the memory dump they will need to troubleshoot the issue.

TROUBLESHOOTING A HUNG WINDOWS SERVER
- Part 1: Why do servers hang?
- Part 2: Preparing to troubleshoot
- Part 3: Resolving the issue
ABOUT THE AUTHOR
Bruce Mackenzie-Low, MCSE/MCSA, is a systems software engineer with HP providing third-level worldwide support on Microsoft Windows-based products including Clusters and Crash Dump Analysis. With more than 20 years of computing experience at Digital, Compaq and HP, Bruce is a well known resource for resolving highly complex problems involving clusters, SANs, networking and internals.
