cutimage - Fotolia
Virtual Instruments makes VirtualWisdom proactive
A major update to Virtual Instruments' infrastructure management product adds proactive analytics, predictive capacity capabilities, interactive topology maps and iSCSI support.
Virtual Instruments has incorporated machine learning into its VirtualWisdom infrastructure management to help better identify and address performance and capacity issues before they occur.
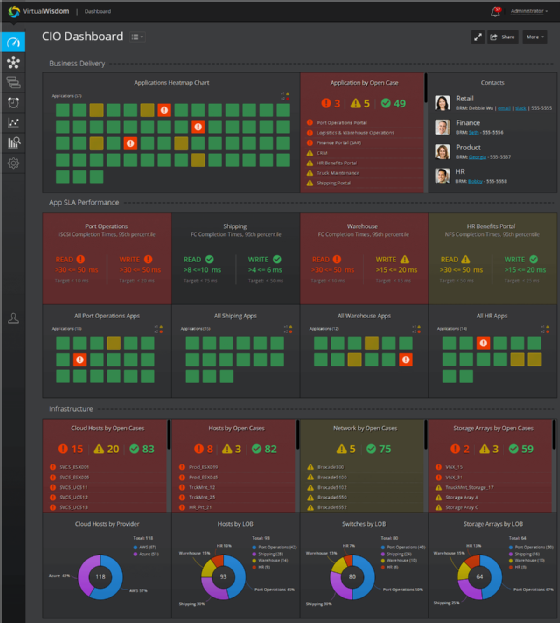
VirtualWisdom 6, which became available this week, adds proactive analytics to its dashboard, predictive capacity management and interactive infrastructure topology maps to enable customers to spot and resolve problems from their applications to their storage systems.
"This was a logical step on a path that Virtual Instruments is moving down," said George Crump, founder and president of Storage Switzerland. "Two or three years ago, they used to capture data and give you information that allowed you to diagnose what was wrong. Now, they're moving to a machine learning capability, where they're actually making the diagnosis for you."
Crump said the capabilities become especially critical for IT professionals managing data centers with thousands of applications and servers and petabytes of storage. He said they no longer have the time to figure out what their systems are telling them.
Hybrid infrastructure management
With the new VirtualWisdom 6 release, Virtual Instruments responded to customer requests for insight into hybrid applications spanning internal and external data centers. The product update can now monitor Windows or Linux host operating systems running on virtual, bare-metal physical or public cloud servers through a single pane of glass. VirtualWisdom requires no agents, unlike options from other vendors, according to Tim Van Ash, senior vice president of products at Virtual Instruments, based in San Jose, Calif.
Also new in VirtualWisdom 6 is a wire-data iSCSI performance probe to complement the existing Fibre Channel SAN and NAS probe. The product update also integrates with Dell EMC VMAX and PowerMax and IBM's SAN Volume Controller to give customers a deeper understanding of how their applications are using the storage infrastructure.
Van Ash said VirtualWisdom never had visibility into storage arrays in the past, but Virtual Instruments plans to support additional arrays from vendors such as Hewlett Packard Enterprise, Hitachi Vantara and Pure Storage. He said the storage visibility would enable customers to better pinpoint and address performance bottlenecks, as well as optimize capacity.
"In the past, we could see that a storage array or a storage filer was having a performance problem, but we couldn't tell you why," Van Ash said. "With 6.0, we now have the ability to correlate the performance issues that the application and the workloads are seeing with the compute, the network or the storage infrastructure itself."

Proactive analysis
Prior VirtualWisdom versions used analytics largely in a reactive way. The latest version monitors the infrastructure on a continuous basis to determine how to best balance and optimize a customer's workload infrastructure and proactively prevent problems, according to Van Ash. He said the product can automatically generate recommendations across the compute, network and storage layers before the customer hits an error state.
"We often find the things that are contributing to performance and utilization issues are the workloads that people forgot, like building management systems that are sitting in a server closet somewhere, but are using shared infrastructure," Van Ash said.
With the new proactive capacity management capabilities, VirtualWisdom analyzes short-term and long-term consumption rates to predict when customers will fill up the storage in their data centers or in the cloud.
"Up until 6.0, we were purely focused on capturing performance data, providing performance recommendations and resolving performance issues," Van Ash said. "We didn't monitor and report on capacity, and we certainly didn't analyze consumption rates to predict the zero point when customers would exhaust the capacity."
Interactive topology maps
New application-centric, interactive topology maps offer visibility from the service level to the applications and the data storage via a single screen. Virtual Instruments used topology maps under the covers to drive the dashboard in the past. But, with VirtualWisdom 6, the company now exposes the capabilities to users.
"We've got a very rich topology that allows you to highlight any object on that topology, and you'll see exactly the path that it's taking," Van Ash said. "And that gives us a very powerful correlation capability."
Van Ash said VirtualWisdom applies the correlation to the product's statistical analysis and machine learning capabilities. That can determine the root cause of a problem with better accuracy and help reduce the time to .
"The topology is now integral to the way we do absolutely everything in the product," he said.
APM tool integration
Virtual Instruments expanded its integration with application performance monitoring (APM) tools, adding support for Dynatrace. It already worked with Cisco's AppDynamics and NetFlow, ServiceNow, VMware vApps and host discovery.
"All of the APM tools can see the health of the servers and give us context around the application. But they really can't see the health of the infrastructure supporting those servers in the data center. We fill in those blind spots," Van Ash said.
Virtual Instruments also offers application discovery capabilities, because users typically deploy AppDynamics and Dynatrace only with their mission-critical or top-tier applications, Van Ash said.
Crump said Virtual Instruments' competition includes data analytics bolstered by artificial intelligence built into storage systems, servers, virtualization products and network switches.
"What makes Virtual Instruments different is the level of analytic processing and machine learning that they're doing and the ability to do all of it instead of just some of it. Nobody, to my knowledge, does it across a broad spectrum -- giving an end-to-end picture of what the data center is doing," Crump said.


