Network monitoring technology today is a mishmash of disparate systems, each anchored by a unique set of tools engineered to determine the network's health. The result is an imperfect arrangement, forcing IT managers to fill in gaps and to deal with management consoles that can be more perplexing than enlightening.
The remedy, according to a Palo Alto, Calif., company ready to announce a new network performance monitor approach, is more technology.
Nyansa Inc. this week is introducing Voyance, a campus and enterprise-grade network monitoring system it contends will let users quickly diagnose performance issues across both wired and wireless networks. The system also provides baseline performance information gathered across Nyansa's customer base to allow enterprises and organizations to compare network performance metrics with their peers.
The Voyance network performance monitor is based on a combination of deep packet inspection (DPI) and cloud-based analytics. It tracks every transaction, and then sends the collected data to Amazon Web Services servers. The data is then analyzed and retransmitted to the user's location, where it can be reviewed by IT staff via an easy-to-understand graphical user display. The system monitors both real-time and historical performance, and provides root cause analysis and remediation recommendations when abnormalities occur.
The company -- which, in advance of this week's formal introduction, counts customers that include Uber, Netflix and Tesla Motors -- is already tracking network performance monitor data collected from more than 350,000 client devices.
Not doing the same old thing with monitoring
"We're not reinventing DPI," said GT Hill, Nyansa's technical director. "What we are doing is automating the process. Voyance provides actionable information. It actually sees everything that's done on the network, and it measures the quality of each transaction."
Pinpointing performance problems in complicated networks is increasingly challenging, said Craig Mathias, principal analyst at the Farpoint Group in Ashland, Mass. "The network is more complex, and with so much information gathered across multiple consoles, how do you determine what's really happening in the network?" Voyance, he said, appears to have solved this issue by not only tracking and analyzing network data, but also by presenting the results in an easy-to-digest manner.
"It isn't just gathering the data, but presenting [results] in plain English," Mathias said. "The whole point is to take [IT staff] who are very busy, and to make them as productive as easily as possible. The simpler the display, the better it is."
I'm an operations guy: I need to know what happened and right now.
Mike Fitzgeraldnetwork architect at Brandeis University
Making the oversight of networks more intuitive and simpler is a continuing challenge. Enterprise Management Associates Inc., in Boulder, Colo., said its research found that today's IT manager has six to 10 different management tools in use at a single time.
Voyance has helped Brandeis University in Waltham, Mass., get a better handle on its wireless network performance, said network architect Mike Fitzgerald. The school, which has thousands of students and faculty accessing an Aruba wireless network that spans more than 2,000 access points, launched Voyance last summer as a Nyansa beta test site.
"All of our networking performance information is now in one place. And it's not just pulling data, it's actually making an attempt to learn our environment, and to learn what's normal and what might be an anomaly," Fitzgerald said, adding that Voyance is highlighting issues that wouldn't have necessarily triggered an alert from the university's other network performance monitor platforms. "I'm an operations guy: I need to know what happened and right now."
Software polls network switches, controllers
Voyance uses a software crawler -- installed either on a dedicated server or virtual machine -- that grabs network traffic passing through network switches and WLAN controllers. Currently, the app supports Cisco, Aruba and Ruckus controllers, but will work with any underlying network infrastructure.
"If something is broken and it's fixed, that's quantifiable," Hill said. "But if you add a feature to the wired or wireless network, how is that measured?" Voyance allows users to determine how network and feature upgrades affected their operations, he added.
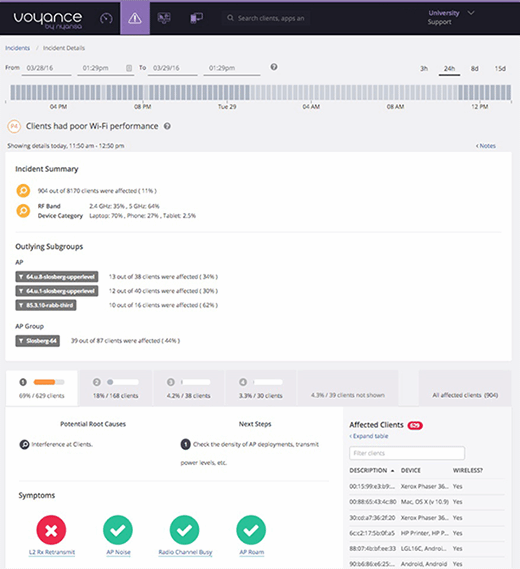
The Voyance console alerts IT managers to problems and suggests probable causes.
"If your CIO comes and says, 'I just paid $100,000 on Wave 2 access points, what improvements did I get from that?' [The answer to that question] is a simple chart within the Voyance system," Hill said.
To create baseline and trending data, Nyansa uses what it calls cloud-sourced data analytics to crunch the data collected from across its user base. That anonymized information is made available, so each Nyansa customer can use it to measure its own network performance against peers.
Voyance is tailored for small, medium, large and extra-large deployments, and offered in one, three or five-year subscriptions. Prices depend on the type of customer and the number of users or nodes. No other hardware, licensing or support costs are required.