
Getty Images/iStockphoto
Wireshark vs. tcpdump: What's the difference?
Wireshark and tcpdump both aid network administrators in packet analysis. Wireshark's simple GUI contrasts with tcpdump's speed and scripting abilities, which enhances management.

Network administrators often envision the path of network traffic like water flowing through pipes. Imagine being able to follow each water droplet's journey across a system and see each droplet's individual parts. Similarly, network analyzers, also called packet sniffers, intercept network traffic to display addressing information and content to administrators and troubleshooters.
Network analyzers are crucial network management tools. Popular network analyzers include Wireshark and tcpdump, which show administrators MAC addresses, IP addresses and payload information. Wireshark and tcpdump help network administrators troubleshoot issues related to packet filters on routers, firewall settings and even failing network interface cards (NICs).
Although Wireshark and tcpdump accomplish similar goals, they operate differently and serve different use cases. However, network administrators can integrate both tools, so it's important to understand when and how to use each for troubleshooting and management tasks.
What's the difference between Wireshark and tcpdump?
At their core, Wireshark and tcpdump both capture and display network data packets. However, their UIs have some differences. Wireshark offers both a GUI and command-line component, while tcpdump operates only via a CLI.
Wireshark's GUI
Wireshark users often rely on its easy-to-use GUI. Its capabilities include the following:
- Detailed packet analysis.
- Advanced filtering.
- Comprehensive UI.
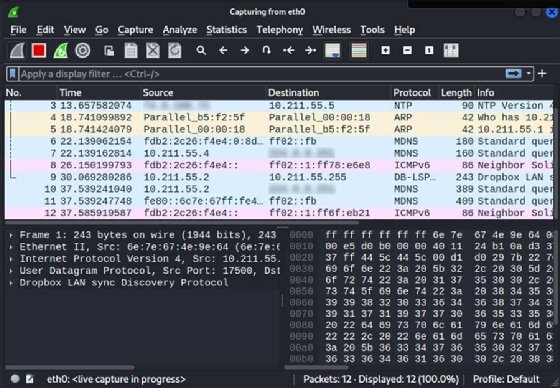
Wireshark can show network administrators information about network packets, with clear delineations between Layer 2 and Layer 3 headers along with the payload. It displays traffic flow in real time for monitoring and saves captures into files network administrators can filter and analyze afterward.
Wireshark's advanced filtering tool is essential because network captures can become large on busy networks. Network administrators might want to define packets before they start captures to ensure they receive desired results.
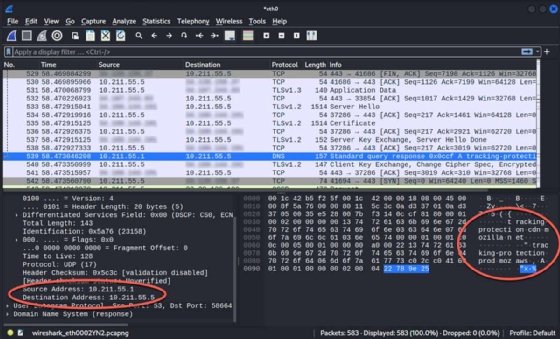
Wireshark's user-friendly UI makes it useful for most tasks. Network administrators can install it on their Linux, macOS or Windows systems. Once Wireshark captures packets, network administrators can select one to view detailed information, such as source and destination MAC addresses, IP addresses and port numbers. The bottom pane in the interface shows the packet's contents. If the contents aren't encrypted, network administrators can read the data, such as emails, files or print job content.
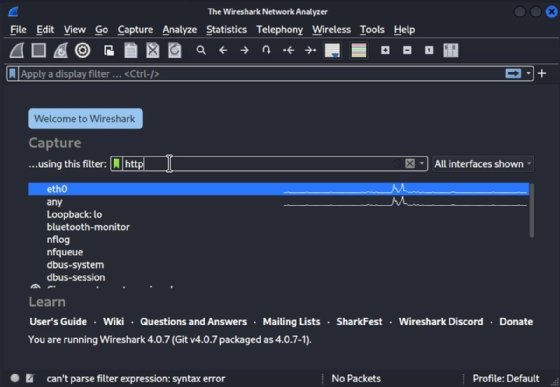
Wireshark also has a command-line option, which is useful for scripting or servers without a GUI. Follow these steps to use Wireshark for packet capturing:
- Launch Wireshark to begin.
- Select the NIC on which to capture traffic.
- Set capture filters to limit results to the desired protocols.
- Select Start capturing packets. Several results appear quickly. Don't run the capture longer than necessary to prevent excessive results.
- Select Stop capturing packets to end the capture.
- Select a specific packet to see details.

Wireshark's interface consists of the following panes:
- Packet list.
- Packet details.
- Packet bytes.
Detailed packet information is crucial because it displays addressing and protocol information.
Wireshark also includes extensive documentation.
Tcpdump CLI
Unlike Wireshark, tcpdump -- also known as WinDump on Windows -- is solely a CLI tool. The tcpdump utility captures packets from the command line. It can display the capture in real time without saving the results, or network administrators can configure the utility to write to a file.
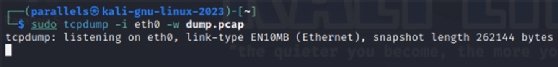
To capture packets with tcpdump, first, start the capture with a command and parameters. Use the following command to start a capture on the eth0 NIC and write the results to a file named dump.pcap.
$ tcpdump -i eth0 -w dump.pcapStop the capture. Use Ctrl+C to end the capture.
Refer to the tcpdump man page or the online documentation for details. The following shows a few common options:
- -i. Specify an interface on which to capture. Use any to capture on all available interfaces.
- -D. List available devices from which to capture.
- Port 80. Filter capture by port number.
- -n. Do not resolve IP addresses to names. Reports captures by IP address.
- -w dump.pcap. Write the capture to a file named dump.pcap.
- -r dump.pcap. Read the capture from a file named dump.pcap.
Wireshark vs. tcpdump use cases
Wireshark and tcpdump are both effective tools, but situations occur where one tool might be a better option. However, they have many overlapping features, so network administrators should use the tool they're most comfortable with.
Wireshark use cases
- Network traffic identification. Network administrators might prefer to use Wireshark when they need to identify network traffic. Wireshark's output shows source and destination addresses, which makes it easier to see the location from which traffic originates or which systems are on the segment.
- Performance management. Wireshark can help network administrators optimize performance management. For example, if network administrators receive numerous helpdesk messages about poor network performance on a specific segment, they can connect their laptops with Wireshark installed to that segment and start to pick up traffic. They might discover several file transfers in progress, such as replication jobs or users uploading files to servers. Network administrators can also identify failing NIC broadcasting errors or clutter that slows other traffic on the segment.
- Menus and filters. Wireshark's Statistics menu contains many performance analysis features. Network administrators can display IO Graphs or use the Protocol Hierarchy view to see the percentages of each protocol found on the network. Another useful filter is IPv4 Statistics > Source and Destination Addresses, which shows specific nodes generating traffic.
Tcpdump use cases
- Fast captures. Many network administrators use tcpdump for an initial capture because it's fast, efficient and configurable.
- Consistency. Administrators can script tcpdump for consistency.
- Later analysis. Because tcpdump can write to a file, administrators can capture a packet and analyze it later.
Wireshark and tcpdump integration
Although Wireshark and tcpdump accomplish similar tasks, network administrators don't have to limit themselves to one type of packet analyzer. Network administrators should familiarize themselves with both and know when to use one over the other.
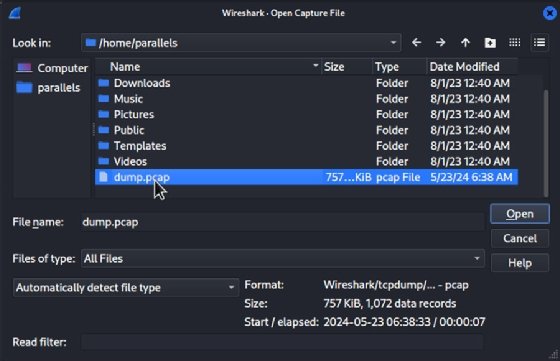
For example, network administrators can use tcpdump to write capture results to files and open and filter them with Wireshark. This is helpful for network administrators who capture packets with tcpdump on Linux servers without a GUI and analyze the results with Wireshark on their GUI-equipped Linux, macOS or Windows workstations.
Wrap-up
Network administrators often consider network analyzers as security tools. But these tools can help network teams troubleshoot, identify hosts, investigate network performance issues and more.
Wireshark and tcpdump are two of the most essential packet analyzers. Wireshark is simple, cross-platform and offers advanced filtering capabilities, while tcpdump is fast, flexible and scriptable. Administrators can get better results when they know how and when to use each tool.
Damon Garn owns Cogspinner Coaction and provides freelance IT writing and editing services. He has written multiple CompTIA study guides, including the Linux+, Cloud Essentials+ and Server+ guides, and contributes extensively to TechTarget Editorial and CompTIA Blogs.