
Sergey Nivens - Fotolia
A Graylog tutorial to centrally manage IT logs
Graylog enables IT admins to manage and analyze log data from multiple sources. Use this tutorial to set up the tool and learn its primary features, such as pipelines and extractors.
With increased adoption of cloud and microservices architectures, IT logs continue to grow in both size and volume -- and, as a result, it's become more difficult for IT admins to quickly search and derive meaning from log data.
Graylog is one example of a centralized log management platform that aims to solve this challenge. Graylog can ingest many terabytes of logs each day, and its web interface enables IT admins to efficiently sort and search through all of that data.
We precede this Graylog tutorial with a dive into the core components of the platform and then walk through the technical steps to set up and use the tool for IT log management.
Data collection and organization
Graylog can ingest different types of structured data -- both log messages and network traffic -- from sources and formats including:
- Syslog
- Graylog Extended Log Format (GELF)
- AWS CloudWatch Logs and CloudTrail
- Beats/Logstash
- Common Event Format (CEF)
- JSONPath from HTTP API
- NetFlow
- Plain/raw text
More important than data collection is how that data is organized to facilitate analysis. Graylog extracts data from raw messages, and then enriches it for use later on. For data that does not follow Syslog standards, users can create what Graylog calls extractors using regular expressions, Grok patterns or substrings. It's also possible to split a message into tokens by using separator characters.
A Graylog feature called streams directs messages to various categories in real time. This enables data segregation and access control. Another feature, called pipelines, applies rules to further clean up the log messages as they flow through Graylog. Pipelines, for example, can drop unwanted messages, combine or append fields, or remove and rename fields.
Data search and analysis
Large volumes of data can be difficult to explore and analyze. With Graylog's Search Workflow, admins can build complex searches and combine them onto a dashboard to better understand large queries and data sets.
A primary aim of IT log analysis is to discover anomalies or situations that require further attention. With Graylog, IT admins can create regularly scheduled reports and use its Correlation Engine to build complex alerts based on event relationships.
Pricing tiers
Graylog has several versions and pricing options:
- Open source. A free version that includes most features available in the Enterprise and Free Enterprise versions, except the Correlation Engine, Search Workflow, scheduled reports, offline log archival and user audit logs.
- Free Enterprise. This free version includes all features in the Enterprise version, but only allows up to 5 GB of log ingestion a day. Technical support is available as a purchased add-on.
- Enterprise. This version includes all features and unlimited technical support. It's designed for organizations that need more than 5 GB of log ingestion a day. Pricing is determined based on the amount of data sent to Graylog.
Get started
Graylog is built on ElasticSearch for log storage and retrieval, MongoDB for metadata and a Graylog node for data ingestion and analysis.
To enable scaling, all components can have multiple instances behind a load balancer. Each combined Graylog and MongoDB node communicates to multiple Elasticsearch instances in an Elasticsearch cluster. The MongoDB instances are combined into a replica set.
One Graylog node serves as the master, with the rest as worker nodes.
The easiest way to get started with Graylog -- and to test out its features -- is to use Docker images.
Assuming that Docker is already installed and configured on either a Windows or Linux system, simply create a docker-compose.yml file:
version: '3'
services:
  # MongoDB: https://hub.docker.com/_/mongo/
  mongo:
    image: mongo:3
    networks:
      - graylog
  # Elasticsearch: https://www.elastic.co/guide/en/elasticsearch/reference/6.x/docker.html
  elasticsearch:
    image: docker.elastic.co/elasticsearch/elasticsearch-oss:6.8.5
    environment:
      - http.host=0.0.0.0
      - transport.host=localhost
      - network.host=0.0.0.0
      - "ES_JAVA_OPTS=-Xms512m -Xmx512m"
    ulimits:
      memlock:
        soft: -1
        hard: -1
    deploy:
      resources:
        limits:
          memory: 1g
    networks:
      - graylog
  # Graylog: https://hub.docker.com/r/graylog/graylog/
  graylog:
    image: graylog/graylog:3.2
    environment:
      # CHANGE ME (must be at least 16 characters)!
      - GRAYLOG_PASSWORD_SECRET=somepasswordpepper
      # Password: admin
      - GRAYLOG_ROOT_PASSWORD_SHA2=8c6976e5b5410415bde908bd4dee15dfb167a9c873fc4bb8a81f6f2ab448a918
      - GRAYLOG_HTTP_EXTERNAL_URI=http://127.0.0.1:9000/
    networks:
      - graylog
    depends_on:
      - mongo
      - elasticsearch
    ports:
      # Graylog web interface and REST API
      - 9000:9000
      # Syslog TCP
      - 1514:1514
      # Syslog UDP
      - 1514:1514/udp
      # GELF TCP
      - 12201:12201
      # GELF UDP
      - 12201:12201/udp
networks:
  graylog:
    driver: bridge
Via the command line -- and in the same directory as the docker-compose.yml file -- run docker-compose to download the images and start Graylog, which can then be accessed via a web browser on 127.0.0.1:9000.
On the sign-in screen, enter the default admin username and password to navigate to the dashboard.
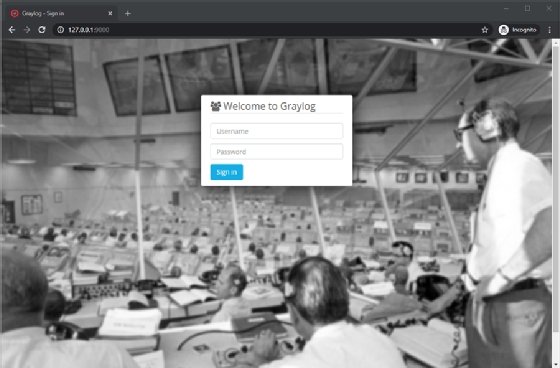
Click on Dismiss Guide to show the main Search screen. Next, click on System/Inputs to configure a Global input to listen to incoming messages.
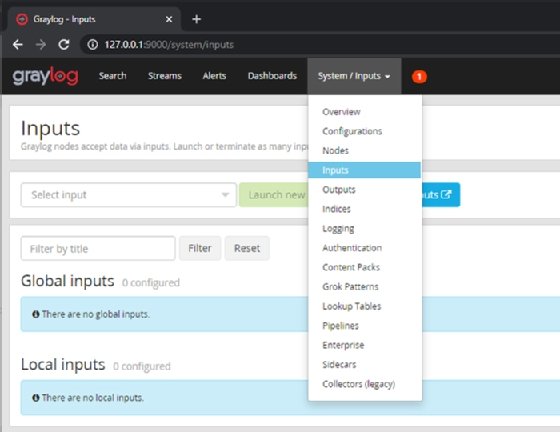
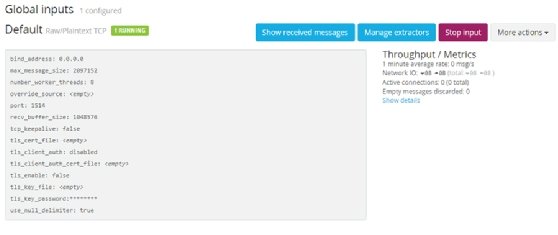
Select Raw/Plaintext TCP from the drop-down selection and click on Launch new input to open the configuration page for the Global input.

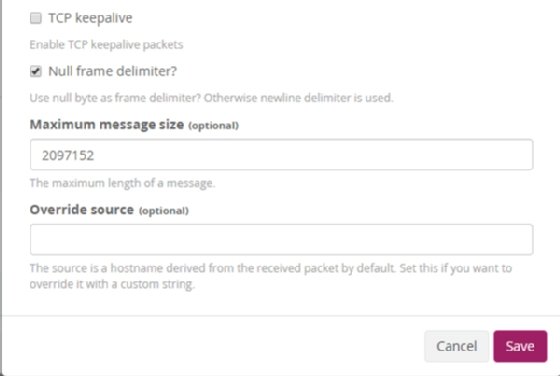
Set the configurations shown in Figure 4.
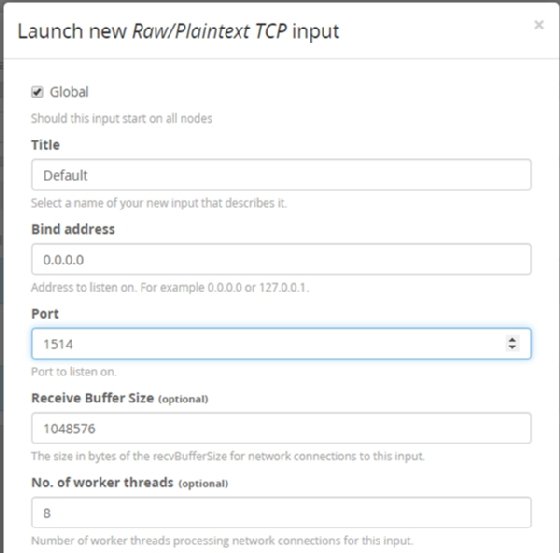
Leave all TLS settings as their defaults, as we won't use them in this tutorial.
Finally, select Null frame delimiter? and leave all other values as their defaults. Then, click Save.
After saving the configuration, the input should look like the Figure 6 screenshot and be set as running.
Send a message via the command line
If you use Linux, or Windows Subsystem for Linux, use the following command to send a test message into Graylog:
echo 'First CLI Log Message!' | nc -N localhost 1514
It is more complicated to send a message using PowerShell, but it's doable, as demonstrated below. Normally, this set of commands would be wrapped in an easy-to-use function, but here, we show the core code only:
$Server  = "127.0.0.1"
$Port    = 1514

$Message = 'First PowerShell Message!'
$Encoded = ([System.Text.Encoding]::UTF8.GetBytes($Message)) + [Byte]0x00

$TCPClient  = New-Object System.Net.Sockets.TcpClient
$TCPConnect = $TCPClient.ConnectAsync($Server,$Port)
$TCPConnect.Wait(500) | Out-Null
$TCPStream  = $TCPClient.GetStream()

$TCPStream.Write($Encoded, 0, $Encoded.Length)
$TCPStream.Close()
$TCPClient.Close()
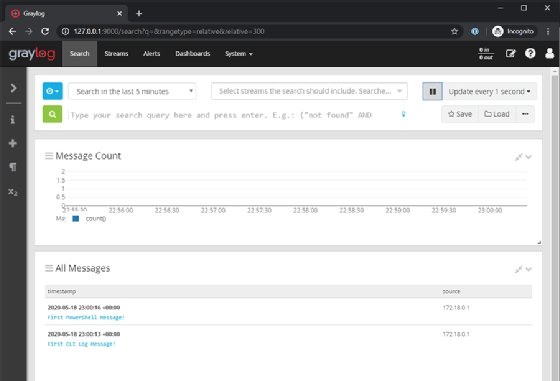
The messages are displayed as shown in Figure 7. Click the Run button to update the Search pane, otherwise you might not see the messages you have sent in.
Configure Rsyslog messages
For most Linux systems, admins configure Rsyslog to send in all system logging messages. To do this, use the following configuration file -- just be sure to restart Rsyslog once done.
# /etc/rsyslog.d/graylog.conf
# Double @@ is for TCP whereas a single @ is for UDP
*.* @@yourgraylog.example.org:514;RSYSLOG_SyslogProtocol23Format
Consider using the User Datagram Protocol (UDP) to handle a large number of log messages; the Transmission Control Protocol (TCP) might result in more reliable messages, with a sacrifice in speed.


