Build a PowerShell performance monitoring script step by step
A PowerShell performance monitoring script defines and keeps track of system metrics. Learn to set up and query performance counters and use the results to build an HTML report.
Editor's Note: Adam Bertram originally wrote this article and Brien Posey has expanded it.
The ability to monitor server performance is critical for IT administrators. Knowing how your servers are performing is the best way to ensure a good end user experience. Server performance monitoring can also help you to detect issues before they can turn into problems.
There are many third-party server monitoring tools. But PowerShell also provides this capability, though using PowerShell for this purpose requires some time and patience.
Decide what to monitor
Before creating a PowerShell performance monitoring script, you must determine what it is you want to monitor. PowerShell can track several metrics, known as performance counters. In this article, we'll build a script to monitor the performance counters below:
- (*)% Idle Time.
- (*). Disk sec/Read.
- (*). Disk sec/Write.
- (*)Disk Queue Length.
- Bytes/sec.
- Interface(*)Total/sec.
- Interface(*)Queue Length.
- File(*)% Usage.
You can retrieve these counter's values by entering the Get-Counter cmdlet. However, using the cmdlet by itself will only provide you with half a dozen counter samples. That being the case, let's take a look at the way that performance counters are structured and how to retrieve a specific counter.
Performance counters are grouped into counter sets, each of which contain individual counters that are somehow related to one another. For example, the IPv4 counter set contains counters related to TCP/IP version 4. You can use the Get-Counter cmdlet combined with the ListSet parameter to retrieve a list of the available counter sets. The command shown below also includes the Sort-Object cmdlet, which alphabetizes the list.
PS> (Get-Counter -ListSet *).CounterSetName | Sort-Object
To view which counters are part of a particular counter set, reference the Counter property. For example, to find counters related to storage, locate all the counter sets with disk in their name, and view all the counters inside those counter sets.
PS> Get-Counter -ListSet *disk*** | foreach {$_.Counter}
Although this command is being used to find storage-related counters, this technique can be easily adapted to retrieve any other type of counter. The most important thing to be aware of is that the results returned are the actual counter names. When you query performance counters -- which will be discussed in the next section -- you must supply the name of the counter that you want to query. By using a command such as the one listed above, you can get the counter name required for the query process.
Query performance counters
Once you've found the names for the counters you want to query, the next thing you must do is retrieve a sample for each counter you're interested in. A sample is simply a counter value as it existed at a particular moment.
There are two steps in acquiring counter samples, although the process can be condensed if you are only working with a single counter. The first step is to create an array containing the counters that you want to examine. In the following code, this array will be named $Counters. The second step is to use the Get-Counter cmdlet to find a sample for each counter listed within the array. Here is an example of this process.
$counters = @(

   '\PhysicalDisk(**)\% Idle Time'*

   '\PhysicalDisk(**)\Avg. Disk sec/Read'*

   '\*PhysicalDisk(**)\Avg. Disk sec/Write'

   '\PhysicalDisk(**)\Current Disk Queue Length'*

   '\*Memory\Available Bytes'*

   '\*Memory\Pages/sec'*

   '\*Network Interface(**)\Bytes Total/sec'

   '\Network Interface(**)\Output Queue Length'*

   '\*Paging File(**)\% Usage'

 )

 foreach ($counter in $counters) {

   (Get-Counter -Counter $counter).CounterSamples

 }
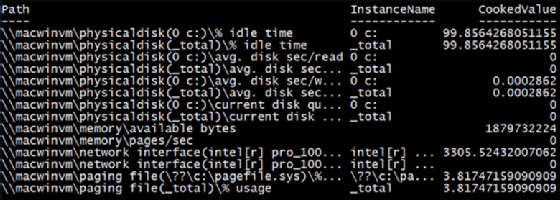
This script will produce an output that looks similar to Figure 1. Notice that you have InstanceName and CookedValue properties. Each counter has an instance that indicates the particular entity of that counter that's being monitored. For example, some PCs contain multiple CPUs, so there might be a counter instance for each individual CPU. Multiple storage volumes could each be listed as an instance, as could multiple network interfaces. Each instance has a value associated with it, and this value is known as the cooked value.

Create an HTML report
To clean up the script output in Figure 1, we can display it in an HTML report. Let's build a basic report that follows a table format and contains the counter category, counter, instance and sample value.
Modify the code from this tutorial to produce the required output.
$samples = foreach ($counter in $counters) {

   $sample = (Get-Counter -Counter $counter).CounterSamples

   [pscustomobject]@{

     Category = $sample.Path.Split('\')[3]

     Counter = $sample.Path.Split('\')[4]

     Instance = $sample.InstanceName

     Value = $sample.CookedValue[0]

   }

 }
The $samples variable will then provide an output that looks like this.

Build an HTML page to display this data.
$htmlHeader = @"

   <!doctype html>

   <html lang='en'>

   <body>

     <table>

       <thead>

         <tr>

           <th>Category</th>

           <th>Counter</th>

           <th>Instance</th>

           <th>Value</th>

         </tr>

       </thead>

       <tbody>

 "@

 $body = ""

 foreach ($sample in $samples) {

   $row = '<tr>'

   foreach ($property in $sample.PSObject.Properties.Name) {

     $row += "<td>$($sample.$property)</td>"

   }

   $row += '</tr>'

   $body += $row

 }

 $footer = "</tbody></table></body></html>"

 $html = $htmlHeader + $body + $footer

 $html | Out-File -FilePath 'C:\ServerPerformance.html' -Force
When the PowerShell performance monitoring script runs, it will output an HTML file that looks similar to the one below in Figure 3. This report contains the counter category, counter, instance and sample value. Build upon this basic report as needed.


