Top 8 observability tools for 2026
Observability tools can help developers and IT administrators improve the delivery, performance and customer experience of applications and avoid potential issues.
Many development teams have adopted a microservices architecture that enables them to deploy their applications across distributed environments. Although this makes the applications easier to build, deliver and scale, it can also make it more challenging to track and troubleshoot the components that make up the environment.
Organizations need visibility into these components to understand how their applications behave. For this reason, many have turned to observability tools, which help them monitor their distributed systems and respond quickly to any problems with the application delivery.
What are observability tools?
An observability tool provides a centralized platform for aggregating and visualizing telemetric data collected from application and infrastructure components in a distributed environment. The tool monitors and analyzes application behavior, as well as the various types of infrastructure that support application delivery, enabling proactive issue resolution.
An effective observability platform is more than just a monitoring tool. It builds on traditional monitoring capabilities, but it provides deeper insights into the data that can help IT administrators optimize performance, ensure availability and improve the customer experience (CX). To achieve this, most observability tools collect and aggregate three types of telemetry data:
- Metrics. Measurements of how a service or component performs over time. For example, an observability tool might gather metrics about memory usage, bandwidth utilization, HTTP requests per second or an assortment of other systems.
- Logs. Records of events that occur on a specific system or application. The event information might be recorded as plain text, structured data or in a binary format. Event logs are often the first thing administrators and developers look at when troubleshooting system or application issues.
- Traces. Representational profiles of entire processes as they're carried out across a distributed system. A trace links together the events in a single request or transaction to provide a complete picture of how it flows from one point to the next. For example, traces can show how applications are contending for network and storage resources.
These three types of telemetry data are often referred to as the pillars of observability because of the important roles they play. Metrics, logs and traces provide organizations with the data they need to understand when and why a distributed application is behaving the way it is. With the right observability platform, organizations gain visibility into all layers of the application stack, enabling them to gain comprehensive insights into their distributed systems over the long term.
Top observability tools in 2026
Several vendors offer observability tools, but it's not always clear how they differ or which ones might provide the most benefits for an organization's particular circumstances. To compile the following list, Informa TechTarget editors researched observability tools extensively, focusing on leading characteristics, such as telemetry capabilities, open source optioning and security. Our research included data from user review analysis and reports from respected research firms, including Gartner.
Here are eight of the leading observability tools on the market, presented in alphabetical order.
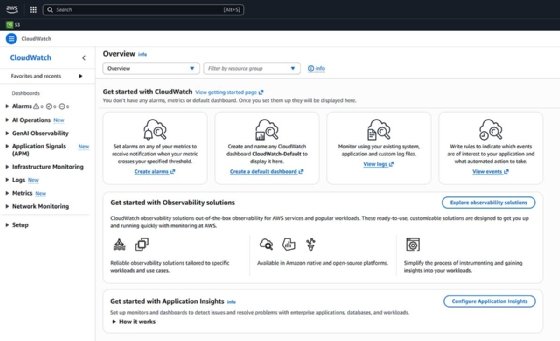
1. Amazon CloudWatch
Amazon CloudWatch is an observability platform that provides a set of cloud-based tools for monitoring resources and applications hosted on AWS, on-premises systems or hybrid environments. The platform enables administrators to collect and track metrics, logs and traces from Elastic Compute Cloud instances and in-house servers that run either Linux or Windows Server. CloudWatch provides administrators with full visibility into application performance, resource utilization and operational health, including infrastructure and network resources.
- Platform. CloudWatch is implemented as an AWS product.
- Coverage. The platform monitors AWS resources and applications, on-premises applications, network connectivity between AWS applications, and the internet connection between AWS applications and end users. CloudWatch can also collect system-level metrics and log data from on-premises databases, servers and OSes.
- Communications. Most AWS offerings automatically generate metrics that CloudWatch can use when monitoring AWS systems or applications. Amazon also provides the CloudWatch agent for gathering additional metrics from AWS offerings as well as on-premises systems.
- Plans. CloudWatch is available in both a free tier and a paid tier. The free tier supports only a limited number of operations, although it can still be useful for many types of applications. The paid tier is based solely on usage, with no upfront commitments or minimum fees.
- Free trial. Customers can try CloudWatch by signing up for the free tier. The free tier is limited to 5 GB of data and 1,800 minutes of live trial data per month.
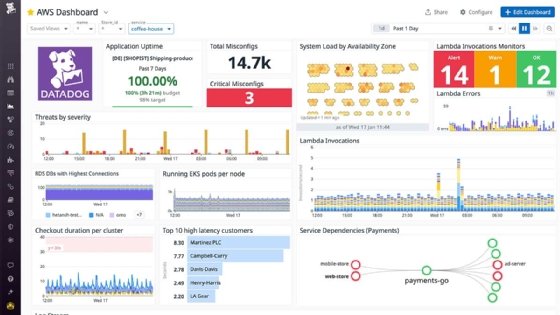
2. Datadog
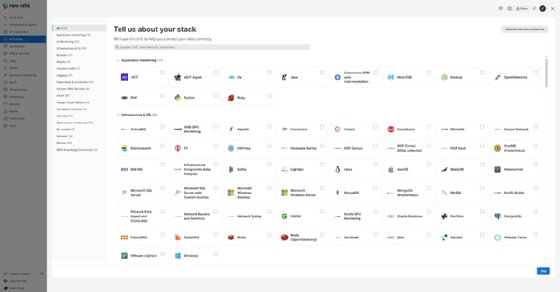
The Datadog observability platform provides full visibility into every layer of a distributed environment, with built-in support for over 900 third-party integrations. The platform provides a single pane of glass for troubleshooting distributed systems, optimizing application performance and supporting cross-team collaboration. Datadog pairs automatic scaling and deployment with intuitive tools that incorporate machine learning for more reliable insights into applications and infrastructure.
- Platform. Datadog is delivered as SaaS.
- Coverage. The platform can monitor infrastructure, applications, databases, logs, network performance and the full DevOps stack, with support for user and network monitoring, synthetic monitoring, and log and incident management. Datadog has also introduced observability for large language models (LLMs).
- Communications. Open source agents running on the monitored systems report metrics and events to the Datadog platform. The agents can run at the OS level or within containers. Additionally, Datadog provides an API that customers can use to instrument their own applications.
- Plans. Datadog offers a wide range of subscription plans, including Infrastructure, Log Management, Incident Response, Application Performance Monitoring, Continuous Profiler and many others. Many of these plans are broken down into multiple subplans.
- Free trial. A 14-day free trial is available.
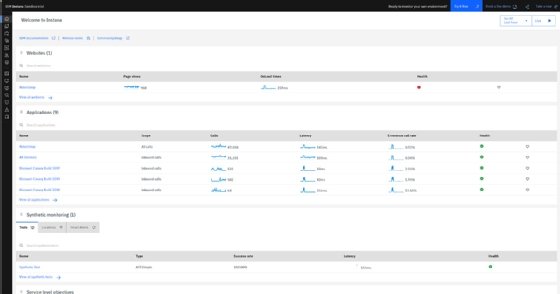
3. Dynatrace
Dynatrace provides an integrated platform for monitoring infrastructure and applications, including networks, mobile apps and server-side services. More recently, Dynatrace has introduced observability features for monitoring generative AI applications, including LLMs and agents. The platform can also analyze the performance of user interactions with applications and includes an AI-driven engine called Davis AI, which supports root cause analysis. Dynatrace supports over 750 third-party technologies and is built on open standards that enable organizations to extend the platform by using the Dynatrace API, SDK or plugins.
- Platform. Dynatrace is delivered as SaaS.
- Coverage. Dynatrace can monitor infrastructure, applications, microservices and application security, as well as support digital experience monitoring and business analytics.
- Communications. The Dynatrace OneAgent runs on each monitored host, collecting system, application, network and log data, and sends the data to the Dynatrace platform.
- Plans. The platform supports a wide variety of plans, ranging from application and infrastructure observability to log analytics and digital experience monitoring.
- Free trial. A 15-day free trial is available.
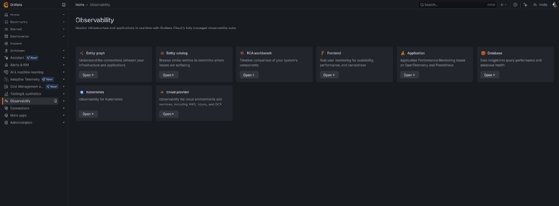
4. Grafana
Grafana offers a centralized platform for exploring and visualizing metrics, logs and traces. The platform includes alerting capabilities and provides tools for turning time series database data into insightful graphs and visualizations. From a central interface, users can create a rich set of dashboards that display telemetric data from a wide range of sources, including Kubernetes clusters, multiple cloud services, Raspberry Pi devices and services such as Google Sheets.
- Platform. Grafana Cloud is available as a fully managed cloud service.
- Coverage. Grafana can monitor infrastructure, applications, data sources, microservices and third-party platforms.
- Communications. Grafana's open source agent runs on monitored devices and collects metrics, logs and traces. The agent is based on open source telemetry standards, such as OpenTelemetry and Prometheus.
- Plans. Grafana Cloud is available in three subscription plans: Free, Pro and Enterprise. The Pro plan starts at $19 per month, and the Enterprise plan starts at $25,000 per year.
- Free trial. Organizations can try Grafana Cloud through the free service. The free tier is an ongoing service that includes 10,000 metrics and up to 50 GB of logs. Users can access the free plan for as long as they want.
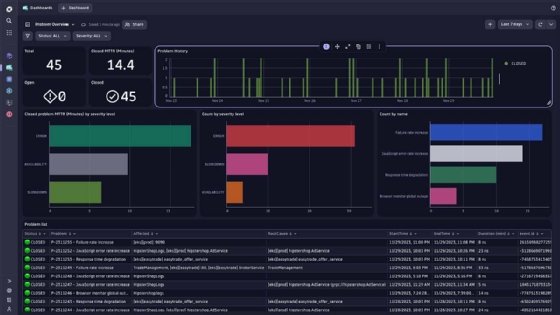
5. IBM Instana Observability
Instana is an observability platform that automatically discovers and monitors applications across various environments, including microservices, containers and mobile applications. The platform offers upstream and downstream visibility into over 300 platforms. Additionally, Instana can trace end-to-end mobile, web and application transactions, providing full context across the entire application stack. When an incident is detected, IBM uses agentic AI to investigate and resolve the problem without the need for manually creating runbooks.
- Platform. IBM offers the Instana back end as a SaaS tool or as a self-hosted system that can be deployed on-premises or in an IaaS environment. Administrators can access the back end through the Instana web interface or through the Instana REST API.
- Coverage. Instana supports a wide range of systems and services, including cloud platforms and services, database platforms, Kubernetes environments, log management systems, messaging apps, OSes, web platforms and more.
- Communications. Instana uses a single-agent architecture to collect data from participating systems. Each host is configured with one agent, which in turn deploys technology-specific sensors that send metrics back to the agent and communicate tracer-related information.
- Plans. Instana comes in two subscription plans: the Essentials Tier and the Standard Tier. The Essentials Tier starts at $20 per month per managed virtual server (MVS), while the Standard tier lists for $75 per month per MVS.
- Free trial. IBM offers a sandbox environment where users can try out Instana.
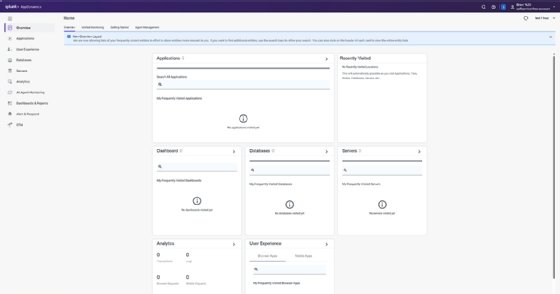
6. New Relic
The New Relic observability platform comprises multiple tools that provide full-stack monitoring across applications and infrastructure. This includes Kubernetes, browser, mobile, network and synthetic monitoring. The platform also provides log management and error tracking, as well as CodeStream integration, which offers a developer collaboration platform. Additionally, New Relic integrates with over 780 third-party technologies and uses applied intelligence to provide automatic insights into the root causes of incidents.
- Platform. New Relic is implemented as SaaS.
- Coverage. New Relic monitors infrastructure, applications, networks, Kubernetes environments and other platforms. It also supports log management, as well as mobile and browser monitoring.
- Communications. Agents installed on hosts or within applications send performance data to the New Relic platform. There are various agents available – application performance management, browser, infrastructure and mobile -- each requiring a license key and an application name.
- Plans. New Relic offers four subscription plans: Free, Standard, Pro and Enterprise. However, New Relic doesn't publicly disclose pricing information for these plans.
- Free trial. Organizations can try New Relic through the Free plan. This plan supports a single user and allows for 100 GB of data.
7. Splunk AppDynamics
Splunk AppDynamics is a performance monitoring and analytics platform that provides real-time visibility into applications and infrastructure across hybrid environments. It helps organizations proactively detect, diagnose and resolve issues using detailed insights into application performance, user behavior and the health of the underlying infrastructure. One thing that makes AppDynamics unique is that its root cause analysis capabilities are not based solely on the infrastructure and application stack. AppDynamics can also detect problems at the code level.
- Platform. Splunk AppDynamics is offered as an on-premises platform and as SaaS.
- Coverage. The platform can monitor many types of applications, including microservices, cloud-native and legacy applications. It provides visibility into cloud environments, including AWS, Azure and Google Cloud, as well as on-premises applications and hybrid environments. AppDynamics integrates with Kubernetes and Docker, as well as databases, web servers and network infrastructure.
- Communications. AppDynamics offers several methods for ingesting data from applications and systems. It uses agents, including AppDynamics Java, .NET, Node.js and other language-specific agents, to collect performance data. AppDynamics supports integration with cloud-native services and offers automatic application discovery to help map complex environments.
- Plans. Splunk AppDynamics offers multiple pricing tiers, including Infrastructure, App & Infra, and End to End. The starting prices -- per host, per month -- for these tiers are $15, $60, and $75, respectively.
- Free trial. A 30-day free trial is available.
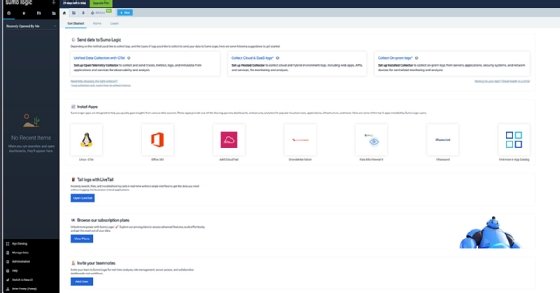
8. Sumo Logic
Sumo Logic is a log analytics SaaS platform built on a cloud-native, distributed architecture. The platform offers a scalable, multi-tenant environment for ingesting structured and unstructured logs. Customers can monitor, troubleshoot and secure their cloud and on-premises applications across various environments and systems, including microservices, containers and Kubernetes. The platform uses machine learning and advanced analytics to ingest and analyze system data, while providing continuous infrastructure and compliance monitoring.
- Platform. Sumo Logic is delivered as SaaS.
- Coverage. The platform can ingest log data from cloud providers, such as AWS, Azure and Google Cloud, as well as from container environments, including Kubernetes and Docker. The platform can also pull log data from web servers, database servers, productivity tools and security applications.
- Communications. The platform provides several options for ingesting log data from source systems. The company's hosted connectors live in the cloud and provide connectivity to cloud services. Installed connectors can be installed on local machines. There is also an agent built on OpenTelemetry that can be used as a unified agent.
- Plans. Sumo Logic offers two plans: Essentials and Enterprise Suite.
- Free trial. A 30-day free trial is available. Users can also view interactive demos or request a live demo from a Sumo Logic expert.
How to choose the best observability tool for your business
Selecting an observability tool is no small task. Decision-makers must choose from a growing number of platforms whose differences aren't always apparent. At the same time, they must determine which tools best meet their specific needs -- both now and in the foreseeable future -- and are flexible enough to accommodate changing business requirements. When evaluating observability platforms, decision-makers should consider the following guidelines:
- The platform should be easy to deploy and manage, automate multiple processes and provide an interface that's intuitive and easy to navigate.
- The vendor should provide ongoing support that includes timely updates and product improvements regularly.
- The platform's underlying infrastructure and supporting components should be reliable and provide easy scalability without adding undue overhead to IT operations.
- The platform should support and easily integrate with the languages, frameworks, platforms and tools that an organization is already using or plans to use to support its distributed applications.
- The platform should provide organizations with comprehensive, real-time visibility into their monitored applications and infrastructure, while delivering the data necessary to make critical business decisions.
- Administrators should be able to easily access telemetry data, reports, visualizations, KPIs and other information from a centralized dashboard to gain real-time insights into the collected data quickly and easily.
- The platform should have the ability to generate alerts and notifications that ensure critical information gets to the right people as quickly as possible.
- The platform should incorporate AI, machine learning, advanced analytics or other advanced technologies to help better use the collected telemetry data.
- The platform should offer predictable and competitive pricing that lets customers operate within budget.
Ultimately, an observability tool must be able to help organizations optimize application delivery, improve the CX and meet their business goals. To this end, decision-makers should evaluate prospective platforms based on the tools, processes and infrastructure they use to support their distributed applications, looking for platforms that help them gather and understand their telemetry data. Only then can they implement an observability strategy that helps them meet the challenges that come with modern applications.
Editor's note: This article was originally written by Robert Sheldon in 2022 and updated by Informa TechTarget editors in February 2025. Brien Posey reviewed and updated this article in January 2026.
Robert Sheldon is a freelance technology writer. He has written numerous books, articles and training materials on a wide range of topics, including big data, generative AI, 5D memory crystals, the dark web and the 11th dimension.
Brien Posey is a former 22-time Microsoft MVP and a commercial astronaut candidate. In his more than 30 years in IT, he has served as a lead network engineer for the U.S. Department of Defense and a network administrator for some of the largest insurance companies in America.