
Nabugu - stock.adobe.com
Dynatrace ups AIOps ante with log analytics refresh
Updates to Dynatrace CoPilot and log analytics for AIOps prompt users to dump other tools, but migrations can be a challenge.

LAS VEGAS -- Dynatrace log analytics and AIOps updates this week have users looking to swap out competing vendors, but tool consolidation is often easier said than done.
Dynatrace first made an overhauled Logs app generally available in October with an updated UI that automatically shows logs in the context of applications and logs surrounding an event for faster troubleshooting. The new app also incorporated a fresh connection between Dynatrace's distributed tracing and log data based on Grail, an overhauled back end for Dynatrace introduced in 2022 that offers parallel processing, support for high-scale log ingestion and an approach to log management that doesn't require administrators to set up schemas or indexes.
This week, Dynatrace fleshed out the integration of this refreshed log analytics tool with its Problems app, which performs automated root cause analysis using its Davis AI and automates the remediation of incidents.
Further updates this week to Davis AI for AIOps included automatic generation of software artifacts such as Kubernetes deployment resources and Git pull requests in response to issues. The new Problems release also includes natural-language root cause analysis, remediation recommendations and best practices based on previous incidents, automatically produced using generative AI.
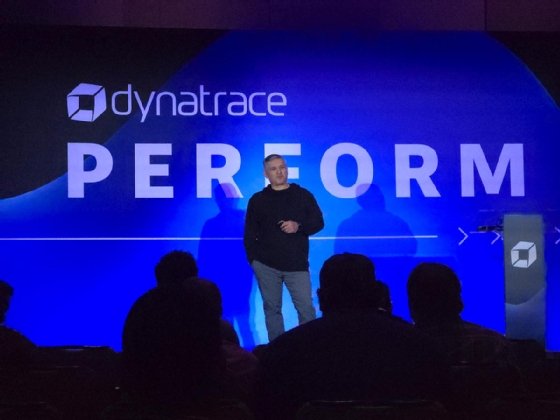
Dynatrace has had the Davis CoPilot AI assistant since 2024, but recently added vector database capabilities to Grail, and linked those into CoPilot to bolster its incident analysis, according to a keynote presentation at Dynatrace Perform this week by Bernd Greifeneder, founder and CTO of Dynatrace.
"We've enhanced Davis CoPilot in such a way that it learns from past incidents," Greifeneder said. "Actually, we take collective intelligence from your various teams, even in multiple languages, and use the vector search so when there is a new incident coming up, we give you the guidance [based on] the learnings from previous incidents."
Other observability vendors such as Honeycomb and Cisco's Splunk offer generative AI copilots that don't require users to learn their query languages. New Relic's AI Assistant can generate remediation suggestions. Datadog also claims its preview-stage Bits AI will generate remediation suggestions and launch autonomous investigations when it becomes generally available.
But Dynatrace is still among relatively few vendors offering automated root cause analysis and remediation in natural language for now, according to Andy Thurai, an analyst at Constellation Research.
"Not many companies are doing it," he said. "Query languages are extremely complicated, especially when an incident happens, [companies] create a war room, and they're trying to figure out what's going on."
Dynatrace could further differentiate by connecting Davis CoPilot auto-remediation suggestions to more of its apps, Thurai said.
"Connecting Davis AI CoPilot with other tools like Site Reliability Guardian or the new Live Debugger could give you an option to ensure you only put out reliable code," he said. In the future, AI agents could also use automated remediation suggestions to proactively resolve issues before they occur, Thurai predicted.
Log analytics updates turn customer heads
Dynatrace's recent log analytics updates prompted some customers to start moving away from other vendor tools. Top Dynatrace competitors such as Datadog and Splunk can also correlate log and trace data, but both require some configuration up front.
"We were a customer of a different log vendor that often had us diving deep into log issues -- had us spelunking, you could say," said Michael Cabrera, director of site reliability engineering at Vivint Smart Home in Lehi, Utah, during a breakout session at Dynatrace Perform. Cabrera stopped short of naming that vendor but didn't correct audience members who referred to Splunk directly during a Q&A that followed his presentation.
"If you have managed that product, you probably felt the pain of logging ingest," Cabrera said. "And what ended up happening is, if I wanted to find information, I would open Dynatrace, look for a trace, and then say, 'Oh, I wonder if that correlates to a log. Let me go open another thing and try to match them up.'"
The cost of using the other product continued to rise, Cabrera said, and he started using the Dynatrace Logs app.
"I'm no longer flipping screens," Cabrera said. "[The] 'View trace' [feature] means if I am searching in my log, I can view the associated trace in the same spot. This was an ah-ha moment."
Nequi, a digital wallet and financial platform provider based in Colombia, has also begun to consolidate three separate observability platforms, including Fluent Bit, which sends log and metrics data to a Grafana UI, Amazon OpenSearch for logs and OpenTelemetry log data collectors connected to Dynatrace.
In the past, manually correlating data from multiple systems to trace a complete transaction was painful, according to Diego Garcia, lead software engineer at Nequi, during a breakout session.
"When the operations teams, the development team as well, has to look up an issue, or understand the behavior of the system or a specific transaction, they have to look in these three platforms and try to understand which is the best platform suited to understand the issue," Garcia said.
Consolidating log analytics into Dynatrace with automatic correlations between logs and traces that don't require configuration of consistent data identifiers during collection has reduced the time it takes Nequi to get to a root cause analysis for incidents by 50%, from 15 minutes to seven and a half minutes, Garcia said.
Tool consolidation pros and cons
Besides faster troubleshooting, consolidating logs into Dynatrace has come with "dramatic" cost reductions, according to Cabrera, although he didn't specify any numbers. However, this return on investment hasn't yet been realized at Nequi, which is still in the process of moving away from Amazon OpenSearch for log data, and for now runs two log management systems in parallel, according to Nequi co-presenter Diego Enciso, observability team lead for the company, during a post-session interview.
"We need to convince the C-level executives" to do a migration project, Enciso said. But he expects to do so because of the efficiencies tool consolidation will bring. "We're working right now to create these metrics, so we can avoid using all the logs and start sampling, and that's another strategic decision."
Another Dynatrace user in the process of switching from Datadog said the AIOps features presented during the keynote looked interesting. However he was concerned about how much log data he would have to ingest to get those features, and what that would cost.
"Everything sounds great, except we're trying to figure out the right log ingestion [plan] that's cost effective," said a senior manager of enterprise architecture at a digital financial services company in an interview at Perform, who requested anonymity because of company policy prohibiting him from speaking with the press. "'All the data for all the things' is outside logical reality from a cost perspective."
Dynatrace introduced new pricing schemes in 2024 to try to ease data ingest costs in response to such concerns, charging less for bulk data ingest and more for frequently queried data. It also allows detailed customization of data retention to try to control costs. Another update rolled out here this week was query pricing, to prevent cost overruns in that area, according to Greifeneder's presentation.
The costs of tool consolidation can also be organizational. Sharing observability tools among teams might be more efficient in the end but requires adjustment from people to learn a new system. For example, FreedomPay took its incident response time from hours to minutes consolidating multiple tools onto Dynatrace, but to do so required an intensive migration process.
"We worked in four-hour segments, three days a week for … nearly six months to actually get a comprehensive observability system pulled together based on Dynatrace," said Mark Tomlinson, senior director of performance and observability at the digital payments platform provider. "That included … establishing the policies and processes that made us able to deploy the Dynatrace product securely, as well as with maximum performance and outcomes."
Moreover, no tool can be everything to everyone, said Constellation Research's Thurai. Companies that work intensively with logs at large scale with long retention periods may prefer to stick with schema and indexing systems from Splunk or Elastic.
"Dynatrace has caught up with quite a lot with logs, but it's not just logs that matter," Thurai said. "Particularly in finance, insurance, those kind of sectors … the compliance, the audit trail, the searchability -- it's about those other things that go around the log."
Beth Pariseau, senior news writer for Informa TechTarget, is an award-winning veteran of IT journalism covering DevOps. Have a tip? Email her or reach out @PariseauTT.
Dig Deeper on Systems automation and orchestration
-
![]()
Dynatrace bets on causal intelligence for AI observability
By: Torsten Volk
-
![]()
Dynatrace DevCycle buy continues observability consolidation
By: Beth Pariseau
-
![]()
IT orgs expand business observability beyond their own walls
By: Beth Pariseau
-
![]()
Dynatrace drops dev observability gauntlet for Datadog
By: Beth Pariseau