lutya - Fotolia
Using predictive analytics methods to answer business questions
Need to know where to put your next store? Or whether or not a promotional campaign will work? Predictive analytics methods may be the answer.
Predictive analytics, a way to predict the future using data from the past, helps businesses answer questions about the probabilities of certain events occurring.
For example, in retail merchandising, you might want to predict the impact of a planned promotion that will offer 30% discounts by asking, "With all the costs involved in creating the promotion, how likely are you to make a profit?" Predictors, or input variables, might include buying potential in the region and success of past promotions. In another example, suppose you offer credit cards to new customers. Predictive analytics methods can help answer the question, "What is the probability that a new customer will be unable to repay his debts?" Predictors might be age, current income and the number of jobs held in the past five years.
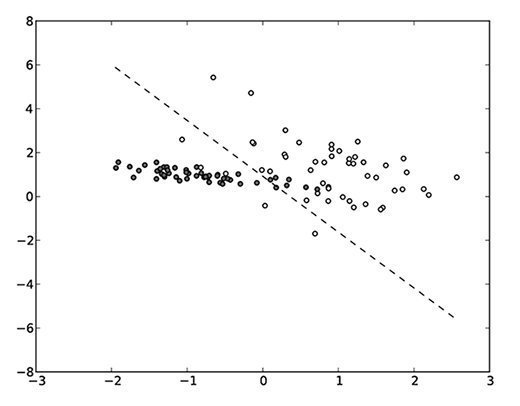
One technique used in predictive analytics is called cluster analysis (see Figure 1). Say, for example, you're a politician in a tight race. Based on previous history, you would like to form neighborhoods of voters (by ZIP code) into clusters. You can segment the population by how well they responded to different stimuli, such as direct advertising, email advertising, TV campaigns or direct appearances by the candidate. If a neighborhood is in a cluster, the candidate's team knows how best to allocate resources to influence a given group of voters.

Predictive modeling
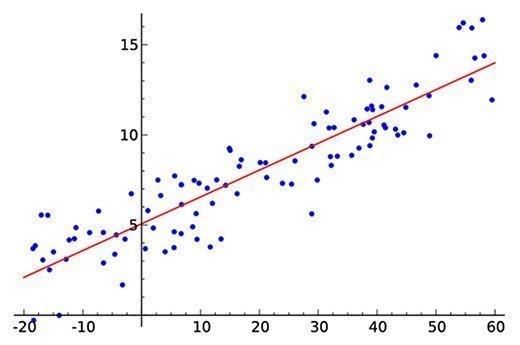
Within predictive analytics, predictive modeling deals with the building of mathematical models to help predict future results. One example is a simple linear regression, as Figure 2 shows.

Suppose you're in a college admissions office, and you want to predict the success of an applicant (Y-axis) based on his or her verbal SAT score. Based on past history, you can use simple linear regression to fit a line -- the equation of the line predicts future college success. Simple regression has one predictive variable (say, SAT scores) and one result (Success). Simple regression is used to create an equation that best fits the data.
The resulting equation might be: Success = .25 * Relative SAT score.
As a more complex (and realistic) example, you might use six to eight variables as predictors. This technique is known as multiple linear regression. Suppose you're a retailer planning to open your 200th store. Considerable data is available showing what made other stores successful or unsuccessful. Key variables include:
- X1 = density of the local population
- X2 = average income of the local population
- X3 = number of attractive stores nearby
- X4 = distance to the nearest competitor
You then use multiple regression to build an equation (based on history) to predict future success.
Future success = W1*X1 + W2*X2 + W3*X3 + W4*X4, where the weights are determined by the multiple regression approach.
Predictive analytics methodology
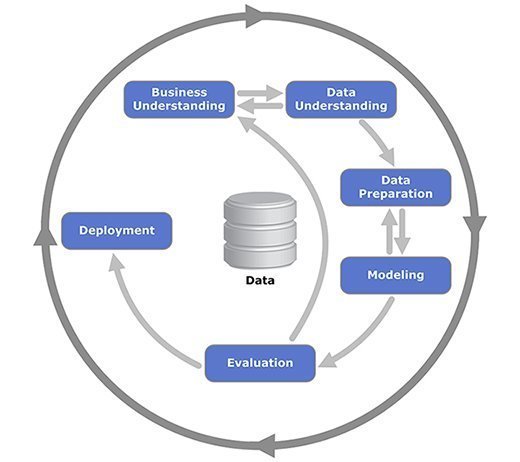
It is important to have a well-defined approach to predictive analytics problems, as Figure 3 shows.

Business understanding: What is the outcome you wish to solve for? What are the likely predictors that will influence that outcome? If you construct a model and create the probabilities of future results, which probabilities will be good enough? Will department heads be comfortable sharing their world with an analytical model?
Data understanding: What data is required for all the predictors? For values of the outcomes? Do you want data for all regions, product lines, etc.?
Data preparation: Is the data clean? Do you have all the variables you need? Is the data in a form that you can import easily into a predictive analytics software package?
Modeling: Do you have the right predictors and the right output variable? Are you looking for clusters or individual results? Have you examined all the algorithms available as solvers?
Evaluation: Is the model working to your satisfaction? Based on historical predictors and outcomes, are you getting good results? If required, now is the time to try new predictors and new modeling techniques.
Deployment: How do you roll out the model? How do you train field staff? How do you measure the results? Should there be an attempt to create an ROI analysis for these techniques in the organization? How do you create the next project?
Predictive analytics methods and modeling can be quite useful for gaining valuable insights into your business. But to be effective, you must establish a methodology that goes from problem definition to deployment. You also can learn from vendors who offer predictive analytics software: Understanding their success stories in your industry can be invaluable.
Vendor case studies
Numerous vendors offer predictive analytics software, including IBM, Oracle, SAP and SAS -- and many smaller targeted vendors (e.g., Alteryx). To understand how useful predictive analytics can be, let's look at how customers have deployed predictive analytics software.
IBM SPSS and the Grevy's zebra
The Grevy's zebra is an endangered species, mostly relegated to Northern Kenya. Scientists wanted to understand how to preserve the species, while taking into account other wildlife and the local population. Data was collected via questionnaires and entered into SPSS. Input variables included the number of hunters in the area, and locations where different species of wildlife were not able to persist. The scientists found SPSS easy to use.
The team did some complex multivariate analysis. One interesting finding was that the local population often hunted zebra for medicinal purposes. Obviously, if the scientists can help bring local medicines to these areas, the zebra population can be preserved.
Alteryx and Southern States Cooperative
Southern States Cooperative is a farm supply and services cooperative, with $2.5 billion in revenue. The company uses predictive analytics methods to get the biggest bang for the buck in marketing campaigns.
Predictors include products people are buying, buying patterns, seasonality, regional differences and weather. The company has been entering data into Alteryx's analytics platform for more than two years. The data helps predict which customers are most likely to respond to marketing campaigns. It also has been valuable in understanding where to put new stores.
SAP KXEN and Disbank
Disbank is a Turkish financial services company with 162 branches. Disbank was having a significant issue with credit card fraud. Responding to competition, the bank had issued many more credit cards than it could analyze for fraud and credit worthiness.
Working with SAP KXEN, Disbank built a series of fraud models in 15 days. Each model created credit scores, which were distributed to 13 fraud agents at the bank. Low credit scores created an obvious way to look for instances of fraud. As a result, Disbank was able to identify 92% of fraud cases, saving Disbank $25,000 a day.
-- Barry Wilderman


