Evaluating data quality requires clear and measurable KPIs
KPIs and metrics are necessary to measure the quality of data. Organizations can use the dimensions of data quality to establish metrics and KPIs for their specific needs.
Understanding how to identify and measure the quality of data using KPIs can make or break data initiatives.
Quality data is the foundation of any successful data-driven organization. Enterprise leaders must recognize that high-quality data is essential to powering analytics- and intelligence-driven products and services. Advanced analytics and AI strategies can generate value and differentiate a company from its competitors.
Data quality is one of organizations' highest priorities as they confront the consequences of poor data quality, said Natalia Demidova, former principal director at Info-Tech Research Group. Consequences can include inaccurate analysis, faulty decisions, missed opportunities and a loss of trust among partners and customers.
Many organizations are still creating processes to determine the level of quality required for their data-driven uses and ensure that data meets or exceeds minimum thresholds.
Organizations know they should pay attention to data quality, but they're sometimes reluctant to give it the credence it deserves, said Karen Bourne, director and data experience advisor at the consultancy Guidehouse.
Ensuring good quality data is an important first step to using AI, machine learning and generative AI programs. This is where key performance indicators (KPIs) can help. KPIs enable organizations to determine the current state of data quality and monitor quality improvements or possible degradation over time.
Data quality dimensions vs. KPIs
Data quality dimensions
Various factors that arise during the data lifecycle -- which runs from data creation to enterprise consumption -- can lead to poor quality, Demidova said. Inaccurate data might include misspelled names, duplicate data for the same event or obsolete data.
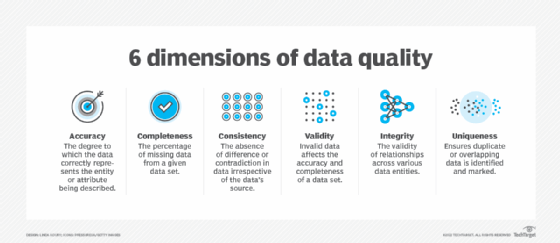
Data practitioners use a list of dimensions for assessing data quality. Most use some or all the dimensions established by the Data Management Association (DAMA). The exact terms used for these dimensions can vary from one organization or practitioner to another, as do the number of dimensions used for assessing data quality. Most lists include the most popular 6 dimensions of data quality: accuracy, completeness, conformity, timeliness, validity and uniqueness. Some lists also include believability, integrity and relevancy and other additional dimensions.
Each dimension speaks to a particular collection of factors that can affect the quality of the data, and those factors come into play at different points in the data's lifecycle, said Igor Ikonnikov, research and advisory director in the data and analytics practice at Info-Tech Research Group.
KPIs
Data quality dimensions, KPIs and metrics are all different. Enterprise executives must understand data quality dimensions from a business perspective so they can establish metrics for determining whether their data meets the minimum quality levels required, said Danielle Beringer, principal at the professional services firm KPMG.
Metrics and KPIs shouldn't be just measurable but should have context for the area in which they're used; data quality is business contextual.
Danielle BeringerPrincipal, KPMG
Data leaders, along with their executive colleagues in business and IT, should determine which data quality dimensions to track minimum acceptable levels of quality for each dimension using metrics or KPIs.
"All of those should be measured, but the context for how they're measured should depend on the organization," Beringer said. "So, metrics and KPIs shouldn't be just measurable, but should have context for the area in which they're used; data quality is business contextual."
Organizations should measure the quality of data at rest and as it moves through the ecosystem, she said. Some organizations might want to be more expansive in how they measure their data quality by moving beyond the DAMA dimensions and similar lists.
Data leaders could opt to create people-centric metrics and KPIs, such as measures for average time to insight by persona, Beringer said. They could also create technology-based metrics and KPIs, such as what percentage of data comes from external sources.
Process-centric measurements might include measures on the percentage of reports run on data not certified for its quality versus how people use certified data.
Data management, data governance and data observability tools generally offer capabilities that data teams can use to measure and report on data quality. Reports help teams determine if they're meeting, exceeding or falling short of their target KPIs.
Data quality KPI examples
The use of KPIs is not new to data teams. Many teams use technical-oriented KPIs, which include the following:
Number of incidents: How many data errors or security incidents that might compromise data occur.
Time-to-response: The time between incident detection and a response from the data or IT team.
Time-to-value: How long it takes to analyze data, generate insights and create value.
Unused data: The number of unused or outdated tables or dashboards.
Missing data: The number of missing entries or values in a data set.
Storage cost: The cost of storing all the organization's data.
In contrast, data quality metrics are business driven, Bourne said.
"The question of whether the data you're using to make decisions is good enough, that's more on the business side," Bourne said. "Data does not have to be perfect to be good enough to use in business operations."
Each organization must determine what good enough means and use KPIs to determine if they're above or below their own threshold. The results dictate what action occurs.
"You create business rules around the data quality dimensions, and those rules are how you're going to measure data quality," Bourne said. "And the metrics are those that you're going to say, for example, 'for this data set in this timeframe, this is our defect rate.' And then KPIs are getting to indicators on whether to say 'use caution when using this data' or 'it's good to use.'"
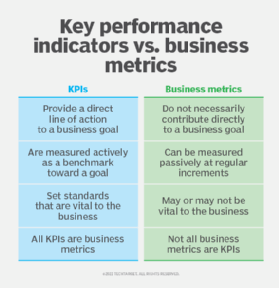
KPIs and business metrics are often considered similar, but they have different uses and business goals.
Business uses for KPIs
Establishing metrics and using KPIs for data quality enables the assessment of data quality in a data-driven way, which is not done in most organizations, Bourne said.
KPIs provide insight into the state of an organization's data quality. Organizations can track improvements over time, alert users to high-quality data and warn users about poor quality data.
Additionally, KPIs can help data teams identify problematic areas, such as technical bottlenecks in the infrastructure layer that are causing low scores, Bourne said. Teams can work on addressing the underlying issues and then monitor KPIs. Improving figures indicate the fixes worked.
Data teams can create dashboards that allow users to delve into data quality metrics, Bourne said. For example, a dashboard could show the percentage of records excluded from a data set so users can determine if the exclusion rate is low enough to produce a valid analysis.
KPIs can also certify the quality of data products and create visual cues to let users know the certification status or KPI calculation frequency. Data teams can report how often they're monitoring data quality and collecting KPIs.
It's important to keep KPIs updated with current business goals. Some organizations have KPI scorecards, review KPIs on a regular schedule and use KPIs to hold teams accountable for data quality, Beringer said.
Mary K. Pratt is an award-winning freelance journalist with a focus on covering enterprise IT and cybersecurity management.