hockey stick growth
What is hockey stick growth?
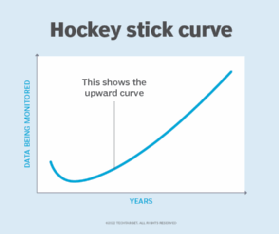
Hockey stick growth is a pattern in a line chart that shows sudden and extremely rapid growth after a long period of linear growth. The line connecting the data points resembles the shape of a hockey stick.
The term is often used to describe what happens when a startup finds its market niche and market conditions are positive. This term is also used in the sciences when plotted data follows the same trend.
Hockey stick charts illustrate dramatic shifts and explosive growth. These charts are characterized by a sharp increase after a relatively flat or quiet period. Initially, there's a period of little growth or stagnation, which is followed by an inflection point that turns into rapid growth. At some point, the exponential growth is likely to level off and linear growth continue.
Hockey stick growth charts
In a hockey stick chart, the x-axis, or horizontal axis, is typically denoted in years while the y-axis, or vertical axis, is labeled as the data monitored in the chart. This data could represent revenue, population or temperature, for example.

Charts described as having hockey stick growth have a similar shape. A hockey stick has a flat or somewhat angled blade that's connected to an upward horizontal shaft. The blade is the furthest set of data to the left, which is the period of flat or subdued growth. The growth point is located next to the blade, right where the data begins an upward trend. And the shaft next to the growth point represents a period of exponential growth.
The sudden shift in the direction of data points indicates that an organization is experiencing hockey stick growth and that it should begin focusing on what caused the sudden growth. The shift may occur over a short period and may indicate some fundamental change. The inflection point, where linear growth becomes exponential growth, can stem from internal or external factors. An internal factor might be a feature, pricing change or Business model that caused customers to flock to the product. An external factor might be a law or regulation that caused a wide scale but previously unseen need that a product can satisfy.

Stages of hockey stick growth
The stages of growth in a hockey stick chart include the following:
- The blade years are a period of subdued growth. In a startup example, this is where the business is trying to establish itself in the market.
- The growth inflection point is the point where the data or revenue growth begins rising drastically. It's the sharp upward growth curve in the hockey stick chart.
- Surging growth is characterized by data trending upward in a straight diagonal line. In a chart, it comes right after the growth inflection point. At some point, the exponential growth is likely to wear off, possibly resuming a linear growth trend.
Some charts also include an additional tinkering stage, which is normally denoted by dotted lines that appear before the blade. The tinkering stage, in a startup business example, is where an idea is examined for feasibility. This stage ends when there's a full commitment to work on the idea.
Examples of hockey stick growth
Two well-known examples of hockey stick growth are the subscription streaming service Netflix and the Groupon, Inc. e-commerce marketplace.
Before Netflix began offering its streaming services in 2007, it experienced a hockey stick growth trend. The business's blade years lasted from 1997 to 2000. Its growth inflection point happened in 2000 when its revenue reached $41 million. Likewise, its surging growth stage occurred in 2001, when Netflix attained around 500,000 subscribers and initiated an initial public offering of $15 a share.
Groupon also experienced hockey stick growth. The company's blade years happened around 2008-2009. In 2010, Groupon hit a growth inflection point where it attained a revenue of over $312.9 million. Its surging growth began in 2011 when Groupon reached a revenue of $1.6 billion.
A third example occurred in 1998 when climate scientist Michael Mann and colleagues published a study containing a hockey stick graph. The graph shows rapidly rising temperatures since the 20th century. Mann updated the graph in 2021, with a current visualization of the hockey stick chart.
Learn about different graphing technologies, including graph databases, how they can be integrated with augmented intelligence and how graphing technology is likely to grow by 2025.


