Getty Images/iStockphoto
Compare Amazon CloudWatch vs. AWS CloudTrail
Amazon CloudWatch and AWS CloudTrail help cloud administrators view configuration history and set up predictive monitoring alerts. Here are the major differences between the tools.
Amazon CloudWatch and AWS CloudTrail are important tools AWS administrators should be aware of.
CloudWatch is a multifeatured tool that enables predictive monitoring and alerting in AWS environments. CloudTrail is a passive logging service that maintains a full history of all configuration changes and management events that occur within an AWS account.
When combined, these tools support the best of both worlds. CloudWatch can consume the passive history of events that CloudTrail tracks, and the two can generate alarms that activate if any unusual patterns emerge. In this article, explore each tool and its respective use cases, features and limitations.
What is CloudWatch?
Amazon CloudWatch is a predictive tool, as it can identify usage trends. It explains how things are currently performing in an AWS environment and alerts administrators if things are about to go wrong.
CloudWatch monitors runtime metrics, such as a Lambda function's CPU usage or an EC2 instance's memory consumption and triggers alarms when indicators exceed preconfigured thresholds. This capability helps administrators take preemptive action before performance and availability problems arise.
What is CloudTrail?
AWS CloudTrail tells administrators who did what and when.
Unlike CloudWatch, CloudTrail doesn't concern itself with runtime metrics. Instead, it logs all the configuration changes users, roles and other services make through the AWS API. This capability is useful for tracking and troubleshooting.
"When a CodeDeploy pipeline mysteriously breaks, I can look in the CloudTrail logs for an UpdateDeploymentGroup event," said Yiwei Shen, a full-stack developer at Xennial Innovations. "Knowing who updated the deployment group, and when, can greatly simplify troubleshooting."
Amazon CloudWatch vs. AWS CloudTrail
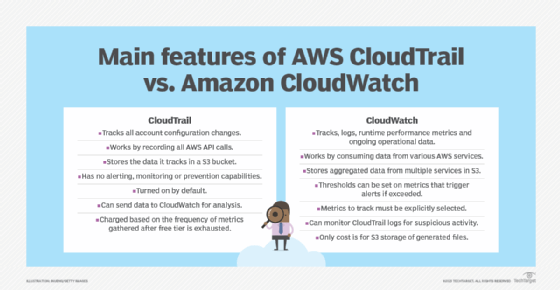
The key difference between CloudWatch and CloudTrail is that CloudWatch actively monitors and analyzes runtime metrics, while CloudTrail passively logs a history of all configuration and state changes that occur through the AWS API.

CloudTrail use cases
CloudTrail provides a digital chain of custody that tracks every change made to resources in an AWS account.
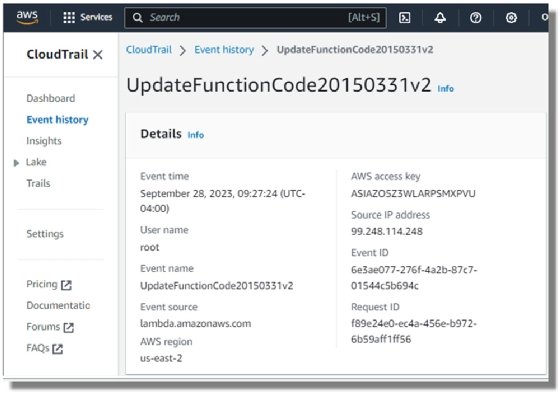
CloudTrail works by recording every AWS API call that happens within an AWS account. Every action a user invokes to create, configure, manage and interact with AWS goes through an API call. A CloudTrail event documents who made the API call, the time of the call and the API they called. CloudTrail maintains a history of these events and stores them in an S3 bucket.

CloudTrail is primarily concerned with auditing, governance and compliance-based use cases. The ability to identify who updated a resource and when can be helpful with debugging and troubleshooting, as well.
If a compliance audit occurs, or if the DevOps team wants to do root-cause analysis on a misconfigured resource, CloudTrail provides the following information:
- What actions were performed on a given resource.
- What prior actions were performed on a given resource.
- Who performed the action in question.
- The time the event occurred.
- What the source of the event was.
CloudTrail is a reactive tracking tool, as it provides insights only into the history of events that occurred in the past. Unlike AWS Config, it cannot stop a malicious configuration setting from taking place, and it can't trigger alarms or trigger alerts when unusual activity occurs. CloudTrail is just an event log.
"CloudTrail will always be my favorite AWS service," said Vaishnav Jois, an AWS cloud engineer who has used the service to identify when S3 buckets unexpectedly disappear or EC2 instances mysteriously go online. "It helps identify which user or service deleted or created resource at a critical time. It's invaluable for debugging."
CloudWatch use cases
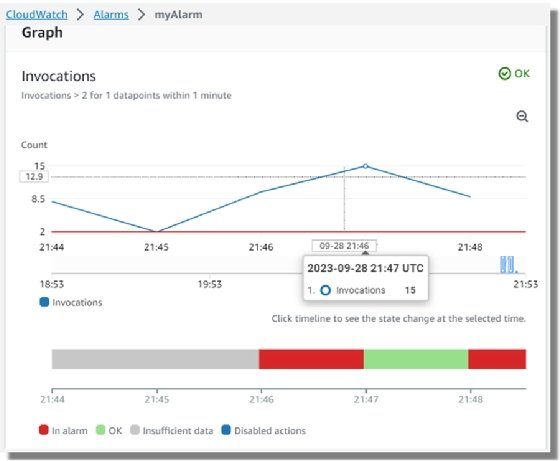
Amazon CloudWatch is a predictive analytics tool. It tracks metrics in real time, maintains an event history and has tools that graph trends over time. CloudWatch can help predict future usage patterns, which administrators can use to allocate resources before bottlenecks or performance issues occur.
CloudWatch works on three primary axes:
- Log file aggregation.
- Real-time monitoring.
- Threshold alerting.
1. Log file aggregation
By default, all log files generated by serverless AWS resources are sent to CloudWatch for viewing.
Administrators can configure other AWS resources, such as Relational Database Service databases or EC2 instances, to publish their log files to CloudWatch. This configuration provides the following benefits:
- Users can view and manage log files through a single, unified CloudWatch interface.
- Users need not access individual EC2 instances to troubleshoot resident software issues.
2. Real-time monitoring
Along with log aggregation, CloudWatch monitors the performance of AWS services at runtime.
For example, teams concerned with capacity management and runtime performance can configure CloudWatch to monitor a variety of metrics including the following:
- Memory usage of EC2 instances.
- Read and write operations on Elastic Block Store volumes.
- Request counts on API endpoints.
- Error rates on AWS Lambda functions calls.
When admins select a metric for analysis, AWS retains data about that metric for up to 15 months. Users can view, graph and access the data easily through the AWS console.
3. Thresholds, alarms and autoscaling
Another compelling feature of Amazon CloudWatch is its alerting feature.
Users can set thresholds for any metrics they wish to monitor and when to trigger an alarm if exceeded. When an alarm goes off, an alert is sent to interested parties through email, text or any other mechanism supported by Amazon Simple Notification Service.
The automated alarm system enables admins to act before any users experience degradation in performance.

CloudWatch thresholds and alarms integrate seamlessly with AWS autoscaling. For example, if an EC2 instance is running out of memory, or a Lambda function needs more processing power, a CloudWatch alarm can trigger an autoscaling routine to run and allocate additional resources.
"The ability to configure autoscaling when CloudWatch identifies a spike in usage is what allows a full-stack developer to sleep at night," Shen said.
CloudWatch and CloudTrail integration
CloudWatch and CloudTrail are two distinct tools that service two separate use cases. However, the two tools intersect and admins can use them together.
For example, CloudTrail logs failed login attempts. A common indicator of an attempted account hijacking is an excessive number of failed login attempts. Admins can track whether an unusually high number of failed login attempts is occurring by pushing CloudTrail logs to CloudWatch. If the number of failed login attempts per minute exceeds a threshold set in CloudWatch, an alert goes out to the security team who can take corrective actions.
CloudTrail and CloudWatch pricing
It doesn't cost anything to use AWS CloudTrail, although S3 storage costs accrue.
Meanwhile, Amazon CloudWatch pricing is based on a variety of factors, including the number of metrics monitored and how frequently metrics get fed to CloudWatch.
Free tier pricing is available for CloudWatch, but monitoring can get expensive once the tiers are exhausted.
The U.S. East pricing catalog for CloudWatch as of September 2023 lists the following:
- $0.50 per GB of log data ingested.
- $0.30 for the first 10,000 metrics monitored.
- $3.00 per dashboard per month.
- $0.10 per alarm metric per month.
For example, it would cost approximately $10.50 to track seven metrics for an application that runs across five EC2 instances.


