Google Cloud operations (formerly Stackdriver)
What is Google Cloud operations (formerly Stackdriver)?
Google Stackdriver was a monitoring service that provided IT teams with performance data about applications and virtual machines (VMs) running on the Google Cloud Platform (GCP) and Amazon Web Services public cloud. Stackdriver was upgraded in 2020 with new features and rebranded as part of the Google Cloud operations suite of tools.
Google Cloud operations enables organizations to monitor, troubleshoot and operate cloud deployments. It adds advanced observability features, including a debugger and a profiler.
The service provides monitoring, logging and diagnostics services to ensure good performance and availability. It gathers performance metrics and metadata from multiple cloud accounts and lets IT teams view that data through custom monitoring dashboards, charts and reports. Cloud operations also enables organizations to troubleshoot incidents as they arise.
Google Cloud operations is natively integrated with GCP and hosted on Google infrastructure. The monitoring capabilities can be used for applications and VMs that run on Amazon Elastic Compute Cloud (EC2). In addition, it can pull performance data from open source systems, such as Cassandra, Nginx, Prometheus and Elasticsearch.
Dan Belcher and Izzy Azeri founded Stackdriver, the company, in 2012. Google acquired the company in 2014.
What are the key features of Google Cloud operations?
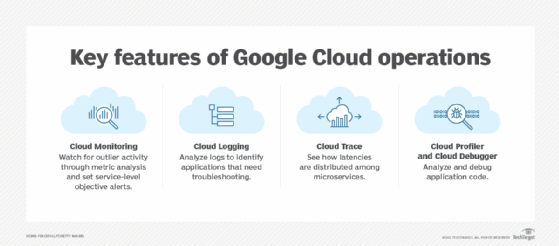
Google Cloud operations' five key features are the following:
- Cloud Monitoring checks the viability of cloud resources and applications. It provides visibility into metrics such as CPU use, disk I/O, memory, network traffic, uptime and other custom metrics. It is based on collectd, an open source daemon that gathers system and application performance data. Users receive customizable alerts when Cloud Monitoring discovers performance issues. It can also monitor Google Compute Engine (GCE) and EC2 VMs.
- Cloud Logging provides real-time log management and analysis for cloud applications. Custom log data is taken from Google Kubernetes Engine (GKE), VMs, and other external and internal cloud services, such as GCE, Google App Engine and EC2. Log data can be archived with Google Cloud Storage and analyzed using the Log Analytics feature. This feature is based on fluentd, which is an open source data collection software. Cloud Logging includes a centralized error management interface that provides real-time visibility into cloud application production errors. It also has sorting and content filtering capabilities based on the number of errors, when an error was first and last seen, and the error's code location.
- Cloud Debugger inspects the state of an application deployed in Google App Engine or GCE, using production data and source code. During production, snapshots are taken of an application's state and linked to a line location in the source code, without having to add logging statements. This inspection doesn't affect the application's performance.
- Cloud Trace collects network latency data from applications deployed in Google App Engine. Data is gathered, analyzed and used to identify network bottlenecks. Trace API and Trace SDK can be used to trace, analyze and optimize custom workloads as well.
- Cloud Profiler tracks relationships and latency across individual functions in a code base. It continuously monitors resource-intensive functions across applications and identifies inefficient code in an application.

How is Google Cloud operations used?
Cloud admins, engineers and developers use Google Cloud operations for cloud application monitoring and logging.
Examples of how Google Cloud operations suite is used include for infrastructure monitoring and application troubleshooting.
Infrastructure monitoring
Distributed cloud infrastructure gets monitored using a combination of the Cloud Logging and Cloud Monitoring features. Logging collects audit logs and platform logs and enables users to create log-based metrics and set up custom alerts. Cloud Monitoring provides visibility into the cloud environment with charts, a dashboard, service-level objective monitoring and uptime checks.

Application troubleshooting
Cloud administrators can use Google Cloud operations to troubleshoot applications in distributed deployments. They can collect data and analyze any log entry for outlier behavior. They can also use the Trace, Profiler and Debugger functions to look for latency and issues with code across distributed microservices in the cloud stack.
Some of the functions that Google Cloud operations lets administrators, engineers and developers perform are the following:
- send uptime checks to test that resources are able to respond;
- create custom user-defined metrics, charts and dashboards;
- write and delete log entries;
- configure multi-tenant logging on GKE, for cases in which teams share a single GKE cluster; and
- ingest logs from third-party applications, such as Nginx, MySQL and Apache Web Server.
Google provides code samples on the Google Cloud operations site to help users perform these functions.
Learn more about cloud management resources and services in this comprehensive guide.


