business process mapping
What is business process mapping?
Business process mapping is the visual display of the steps within a business process showing how it's done from start to finish. This sort of mapping provides a concise picture of the steps needed to bring a product, service or other process from start to completion and the sequence of steps that must take place.
A flow chart is often used to depict the steps and their sequence. Such charts usually move from left to right or sometimes from top down. Flow charts typically use well-established symbols to depict key pieces of the process, such as start, stop, input and data.
These depictions make it possible for everyone in an organization to understand how to complete a business process. They also help external stakeholders, such as regulators, understand how an organization's business processes work. As such, business process mapping supports compliance to the established process and regulations.
Business process mapping is part of overall workflow management, which also includes business process modeling. Business process modeling provides more detailed representation of a process and incorporates additional organizational material.
Business process mapping is also called process charting, a nod to its early 20th century roots.
What are the goals of business process mapping?
Organizations typically use business process mapping with the following goals in mind:
- Compliance. Process mapping ensures adherence to best practices, regulations and standards.
- Communication. Communicating details of a process to team members and other stakeholders is easier with mapping. For example, new employees can easily understand a business process they're involved in.
- Visibility. Mapping enhances business process visibility into a process and the steps required to achieve a workflow.
- Standardization. Mapping helps make process performance more standardized and consistent.
- Auditing. Mapping simplifies internal auditing of processes and helps optimize process performance.
- Training. Employees can get trained faster and more easily with business process mapping.
- Continuous improvement. It enables ongoing assessment and improvement of processes.
Many organizations use business process mapping tools to analyze business processes and metrics as part of reengineering a business process or to improve specific steps within it.
What are the different types of business process maps?
There are several approaches to business process mapping. The following types are the most commonly used:
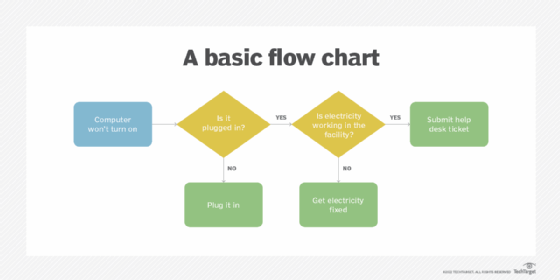
Basic flow chart. Also known as the top-down process flow chart, this is the simplest of the common mapping types. The basic flow chart works best for simple processes. It depicts the major process steps in a top-down fashion, with similar tasks and activities grouped together at distinct points on the chart. It enables managers to easily see which tasks and activities are redundant and where eliminating steps and work simplification is possible.

Detailed flow chart. This is similar to the basic flow chart, but it includes more details and is used to illustrate more complex processes.
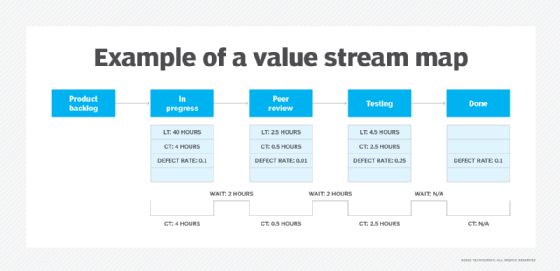
Value stream map. This is a type of detailed flow chart. Value stream mapping techniques are often used in Lean Six Sigma methodology.

Business process modeling diagram. A more formal type of process mapping, these diagrams use specific, defined language along with Business Process Modeling Notation (BPMN) symbols for representing component tasks.
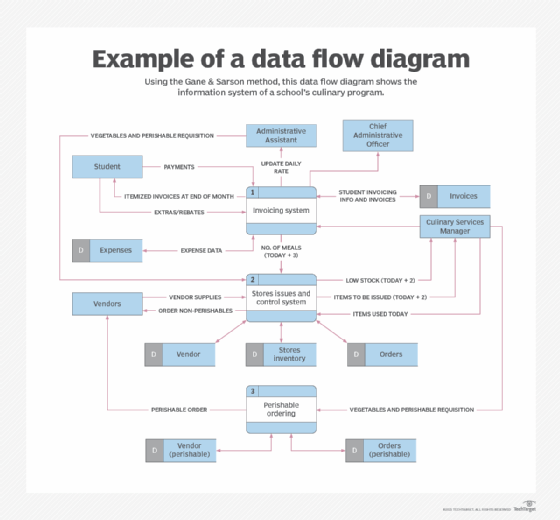
Data flow diagram. As its name says, a data flow diagram follows the flow of the data itself as it works its way through an entire process, usually going from unprocessed to processed data.

Swim-lane flow chart. Also known as swim-lane diagram, these charts use lanes to represent which departments do what within a process, with each lane depicting which department -- or which role within a department -- does what, when and how within a process.
Suppliers, inputs, process, outputs and customers (SIPOC) diagram. This visual representation identifies the suppliers, inputs, processes, outputs and customers that are part a process from start to finish. SIPOC diagrams are sometimes called high-level process maps.
How to create a business process map
Creating a business process map involves the following five steps:
- Identify the process to be documented.
- Document significant points, such as the start and end points of the process and each task in between those two points. As part of the process documentation, indicate decision points; these are points where a yes or no decision is required, with each answer leading the process in either one of two directions in the document process.
- Gather information. Managers must observe the process or gather information from workers to create an accurate understanding of what tasks or activities are involved in the process and the sequence in which they happen.
- Involve participants and stakeholders by asking them to help identify inefficiencies and redundancies.
- Map the process, keeping information clear and simple.
Benefits and challenges of business process mapping
Business process mapping provides the following advantages to users and organizations:
- clear directions for each stakeholder on how the process should be performed;
- visibility into all the steps and tasks within the process and the sequence of those steps and tasks;
- increased control of the process, with improved compliance to steps;
- continuous improvement as mapping enables identification of redundancies and inefficiencies and encourages business process improvement;
- less complexity because mapping helps identify and remove bottlenecks and other problems within the process;
- lower costs as processes are streamlined;
- reduced chance of errors because everyone understands the process and how it should happen; and
- better and more uniform employee onboarding and training because it is geared toward a standard way of performing the process.
Business process mapping can yield many benefits for an organization, but there are also challenges. Issues organizations encounter include the following:
- failing to adequately scope out the process, thereby incorporating into the map activities and tasks that aren't truly part of the current process;
- making the mapping overly complex with a level of detail beyond what is necessary;
- unrealistic expectations, such as overestimating how fast a task can be completed;
- failing to revisit and update the process map, which makes it irrelevant or inconsistent with the way a process operates in real time; and
- not integrating the maps in ways that they can be used to help improve the processes and overall business process management (BPM).
Business process mapping symbols and examples
Business process mapping uses various symbols to indicate different parts of the process. They include the following symbols:
- An oval typically indicates the start and end points.
- A rectangle is a process box that indicates specific steps or tasks to be completed and may include who does the task and how long it takes.
- A diamond represents a decision point in the process at which a yes or no -- or true or false -- response is needed.
- Arrows or connectors show how one point in the process leads to another.
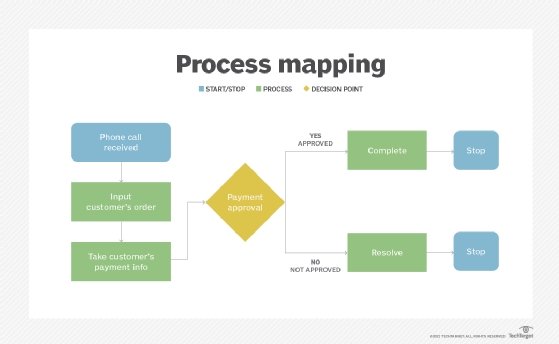
An example of a simple business process map would show how an organization fulfills phone orders coming into a call center (see Figure 4). The start point is receiving the phone call, which is listed inside an oval.
Follow-on tasks include a worker inputting the customer's order and taking the customer's credit card number for payment; each of these tasks is listed within a rectangle with an arrow leading from the start oval to the next rectangle to the next rectangle.
Next comes a diamond, inside which is the payment-approved task. Two arrows lead out from the diamond to two other rectangles: one arrow indicates "yes," for payment approved and the other arrow indicates "no," for review required.
This path from the "yes" arrow leads from the diamond to the follow-on tasks that must happen to complete the sale and deliver the product to the customer.
The "no" arrow leads to the follow-on processes that the company wants to have happen if a payment is not approved.
Both paths lead to an end point, which is listed within an oval.
Business process mapping uses other symbols as well, with these additional symbols representing specific items. There are shapes to indicate data, input, a single document and multiple documents.

Process mapping tools and software
Business process mapping can be done using paper or a white board. However, software applications have mapping tools that bring uniformity to this exercise.
These management tools let organizations create process maps for multiple processes. They also support collaboration among stakeholders involved in the exercise and often bring some level of automation to processes.
Many software vendors package mapping functions as part of a broader enterprise BPM suite of products. Standalone business process mapping software products are available, too. They often have easy-to-use templates and intuitive click-to-create functions that encourage broader adoption in an organization.
History of business process mapping
The discipline of business process mapping dates back to the early 1920s. Frank Bunker Gilbreth, an American industrial and efficiency engineer, introduced it to the American Society of Mechanical Engineers (ASME) in a 1921 presentation called "Process Charts -- First Steps in Finding the One Best Way."
Others in industrial engineering integrated Gilbreth's ideas, modifying and teaching them in subsequent decades. ASME adopted a version of Gilbreth's original concept and symbol set in 1947 when it established the ASME Standard for Process Charts.
Gilbreth is also known as the father in the family memoir, Cheaper by the Dozen, written by two of his 12 children. The book is about his advocacy and academic work for improved efficiency, and his efforts to apply his ideas to home life.


