web analytics

What is web analytics?
Web analytics is the process of analyzing the behavior of visitors to a website by tracking, reviewing and reporting the data generated by their use of the site and its components, such as its webpages, images and videos. The goal is to provide actionable insights that can help the site owner optimize the website for users and meet business objectives such as increased traffic, conversions or sales.
Collecting user behavioral data on a website or web application and analyzing that data for a specific purpose facilitates making decisions to achieve that purpose. Analytics tools communicate with web browsers to track and analyze online behavior, then generate results in human-readable formats like tables, charts or graphs.
Data the tool collects may include traffic sources, referring sites, page visits or views, paths taken and conversion rates, plus other metrics such as the following:
- Overall traffic to the site or app.
- Bounce rate.
- New visitors.
- Returning visitors, or repeat visit rate.
- Time spent on the site.
- Monthly unique visitors.
Besides those metrics, web analytics may track customer clickthrough and drilldown behavior and determine the sites from which customers most often arrive.
The compiled data may be part of customer relationship management analytics (CRM analytics) that is often used to facilitate customer-oriented decision-making.
Who uses web analytics?
Web analytics can benefit any business or individual that owns a website or web application and needs a way to understand and optimize its performance. The collection and analysis of web analytics can reveal ways to attract more visitors, retain more customers and even increase revenues from each customer.
Web analytics are also useful for the following:
- User interface or user experience designers.
- Product managers.
- Data scientists.
- Digital analysts.
- Digital marketers.
- E-commerce specialists.
- Content managers.
Importance of web analytics
Web analytics is important because it provides tangible data that can facilitate decisions and actions regarding a web asset. It can serve as a business metric for promoting specific products to the customers most likely to buy them and to determine which products a specific customer is most likely to purchase. This can help improve the ratio of revenue to marketing costs and boost the company's revenues, profits, profitability and return on investment (ROI).
Web analytics that are available in the right form and in a timely manner can help a business or individual in all these ways:
- Personalize the site to repeat users or customers to enhance their site and brand experiences and capture their loyalty.
- Determine the likelihood that a given customer will repurchase a product after purchasing it in the past.
- Monitor the money customers (or specific groups of customers) spend to guide future strategies for sales (e.g., upsells or cross-sells) or promotions.
- Observe the geographic regions from where the most and least number of customers visit and purchase specific products and use this information to guide location-specific sales or promotional strategies.
- Predict which products customers are most and least likely to buy in the future and present them with recommendations most likely to yield a sale.
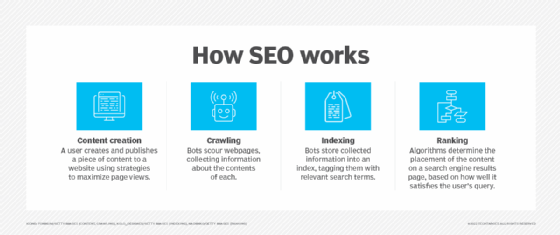
- Track search queries that generate the maximum traffic to the site and use the data to create and optimize site content using search engine optimization (SEO) strategies.
- Analyze the top referral sources to invest in advertising on the appropriate social media sites and optimize ad spend and ROI.
Web analytics process
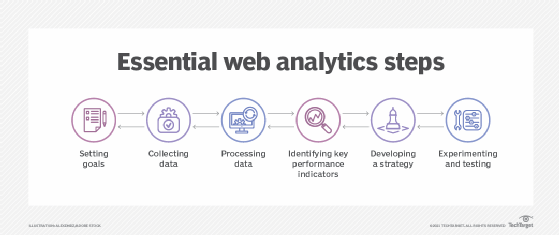
The web analytics process transcends simply installing a tool to capture user data. It involves all these important steps:
- Set goals. The first step is for businesses to determine goals and results sought with web analytics such as increased sales or higher customer satisfaction and brand awareness. Some goals can be quantitative, such as increasing sales by a certain percentage, while others can be qualitative, such as enhancing customer experiences.
- Collect data. The second step is to collect data with an analytics tool like Google Analytics. This data mainly comes from HTTP requests, including data at the network and application levels. It can be combined with external data like Internet Protocol addresses to interpret users' web usage and capture other relevant information about the user, such as their location and clickthrough rates.
- Process data. The next stage is to process and transform the collected data into insights that facilitate decision-making.
- Identify key performance indicators (KPIs). KPIs are a quantifiable measure to monitor and analyze user behavior on a website, such as page visits, traffic sources, bounce rates, unique users, user sessions and on-site search queries. They help track progress toward a specific goal.
- Develop an analytics-driven strategy. This stage involves implementing insights from web analytics to formulate strategies aligned to the organization's goals. For example, analytics about search queries can clarify what users are searching for on Google and guide content strategy development.
- Experiment to validate and implement the strategy. Experimenting with different strategies can help identify one that yields the best results. With A/B testing, for example, a business creates two versions of a piece of content (e.g., an email message) to gauge the response of different audience subsets, then uses the "winning" version to send to the larger audience to optimize a sales or marketing campaign.
Main categories of web analytics
There are two main types of web analytics.
Off-site web analytics
Off-site web analytics involves monitoring visitor activity outside the site to measure their behaviors. The data is collected from resources across the web, such as social media, search engines and forums. It provides insights into how a business is performing against its competitors.
On-site web analytics
On-site web analytics tracks visitor activity to a specific site to gauge its performance. This data, which is usually more relevant to the site owner, can include details that demonstrate visitors' site engagement, such as popular content or pages. Two technological approaches to on-site web analytics are log file analysis and page tagging.
Log file analysis, also known as log management, is the process of analyzing data from log files to monitor, troubleshoot and report on a website's performance.
Page tagging requires adding code snippets called tags into a website's page code using a tag management system. The goal is to track site visitors and their interactions via metrics like the number of pages viewed and number of unique visitors.
Web analytics tools
Web analytics tools report important statistics that can help businesses understand what's happening on their website or web app and use the insight to make decisions. These tools are also used for product analytics, social media analytics and marketing analytics.
Examples of web analytics tools include the following:
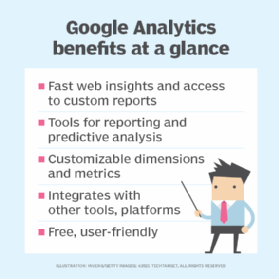
- Google Analytics (GA). GA is a web analytics service to monitor website traffic, behaviors and conversions. Available free to any user with a Google account, it includes numerous tools to capture customer insights from across devices and platforms.
- HubSpot. HubSpot's marketing analytics and dashboard software helps measure the performance of websites, landing pages, emails, social media accounts and other marketing assets from a single dashboard. Like GA, HubSpot offers some services for free; more capabilities are available in a paid version.
- Semrush. Semrush provides useful information about a site's health, keyword rankings, traffic trends, and the impact of these aspects on overall performance from a single dashboard. Its tool suite integrates with other analytics platforms to generate more useful and actionable insights.
- Crazy Egg. Crazy Egg enables site owners to better understand site visitors and their behaviors and use this information to optimize the site. It includes numerous features to understand customer journeys, get user feedback and analyze website content, such as heatmaps, traffic analysis, A/B testing, error tracking and user session recordings.
- Microsoft Clarity. Microsoft Clarity collects user experience data as those users interact with a website. It is installed on the site using a JavaScript tracking code and is free to use.
- Kissmetrics. Kissmetrics is a customer analytics platform that gathers website data and presents it in an easy-to-read format. The platform also serves as a customer intelligence tool, as it enables businesses to dive deeper into customer behavior and use this information to enhance their website and marketing campaigns.
Customer data and behavior analytics from tools like Google Analytics can give content managers insight into the kind of content site visitors want. Explore ways analytics can improve organizations' content strategies.