APM vs. observability: Key differences explained
If you're debating using application performance monitoring or observability to gather data and improve the user experience, consider these differences between them.

APM and observability are techniques organizations can use to assess an application's health and provide a good UX. However, these tools work in entirely different ways.
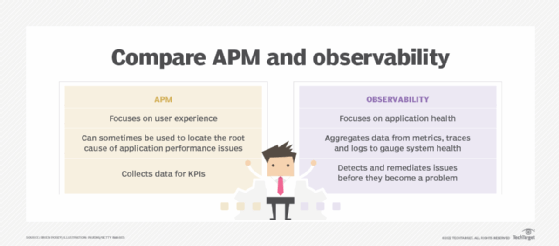
APM focuses directly on UX. Some APM tools even monitor UX in specific situations, such as when users access an application from a virtual desktop environment.
Observability can loosely evaluate UX, but it tends to focus more on an application's health. While observability isn't always the best tool for tracking UX, it can be used proactively to detect and remediate issues before they begin to affect it.
Let's explore these terms in more depth.
What is APM?
As its name suggests, application performance monitoring (APM) is a tool to locate the source of application performance issues. Even so, APM goes beyond what might be expected from basic performance monitoring offerings.
This article is part of
What is APM? Application performance monitoring guide
APM is often used with modern applications to assess UX. At a general level, this might mean tracking an application's load along with KPIs. Doing so enables an organization to monitor UX and provide visibility into how that experience changes as an application's workload increases.
Some DevOps teams incorporate APM into the application development process to avoid putting a change into production if it's found to affect performance adversely.
There are many other aspects of APM. Some APM tools, for example, help with root cause analysis. Modern applications are highly complex and might span multiple systems and numerous microservices. As such, an APM tool might help an organization identify which part of the application is causing the performance problem.
Other APM tools map all the components and infrastructure an application relies on. When performance problems occur, the APM tool can compare real-time metrics with historical telemetry data to determine where the problem resides.
Whether an APM tool is oriented toward performance monitoring or delves into monitoring an application's health and stability, nearly all APM tools contain a rich alerting mechanism to notify teams when something goes wrong.
What is observability?
Like APM, observability is a method for determining the overall health of complex systems and IT workloads. While APM collects data for KPIs, observability aggregates data from various sources to paint a more complete picture of system behavior.
Observability uses the following data sources, which are often referred to as the pillars of observability:
- Metrics. Metrics generally refer to raw performance data and might represent anything from the number of CPU cycles consumed at a given moment to the time an e-commerce application needs to complete a credit card transaction.
- Traces. Traces help to monitor the interaction between the components in a complex system. A network trace, for instance, can track the path packets take to their destination. An application trace can also track how an application's components are used.
- Logs. Logs can take many forms, including informational, error or warning. An informational log entry might be generated, for example, when a process is created. At the same time, an error event might be added to a log if that process were to terminate unexpectedly.
What are the differences between APM and observability?
APM and observability have different use cases, but both can detect problems and keep applications running smoothly. They can also assess and potentially improve the end-user experience, particularly application responsiveness. However, they work toward that goal differently.
APM actively collects internal state data and data related to application response times, which correlate directly to UX. Some APM tools are designed to monitor the underlying infrastructure and the application, enabling the tool to perform root cause analysis when problems occur.
Observability takes the data in logs, metrics and traces and uses it to form an overall health assessment. Even though the goal is to ensure a good UX, observability doesn't directly focus on gauging it. Instead, observability applies the principles of control theory, which essentially state that it's possible to understand what's going on with a system by examining its inputs and outputs. Examining logs, metrics and traces collectively enables a tool to assess the application's health and determine if users are having a good experience. Some observability tools also collect UX metrics.
How APM and observability can be used together
In practice, APM and observability are often used together. APM detects and alerts users to performance problems that affect the end-user experience, but as a general rule, APM tools do little to diagnose and correct the problem.
That's where observability comes into play. Observability identifies the root cause of the problem affecting the end-user experience. A commonly used analogy is that APM is similar to a car's check engine light in that it tells the driver when there's a problem. In contrast, observability is more like a mechanic connecting an on-board diagnostics scanner to the car to retrieve information about why the check engine light came on.
Similarly, an APM tool can alert users of an issue, leading them to use an observability tool to investigate it further.
APM and observability tools
A large number of vendors offer APM and observability tools. Many started as APM vendors but now include capabilities for both functions in their products. In addition, many support OpenTelemetry, an open source observability framework that provides APIs, SDKs and tools for collecting metrics, traces and logs from IT systems. It's designed to simplify the collection process and prevent vendor lock-in.
The following are some examples of notable APM and observability tools listed in alphabetical order, including several open source technologies:
- Amazon CloudWatch (AWS).
- Apache SkyWalking.
- Azure Monitor (Microsoft).
- BMC Stackify.
- Chronosphere Observability Platform.
- Datadog.
- Dynatrace.
- Elastic Observability.
- Google Cloud Observability.
- Grafana Cloud.
- Honeycomb.
- IBM Instana Observability.
- New Relic.
- ServiceNow Cloud Observability.
- SigNoz.
- SolarWinds Observability SaaS.
- Splunk AppDynamics.
- Splunk Observability Cloud.
- Sumo Logic Application Observability.
- Uptrace.
Editor's note: This article was updated in March 2025 to add more details about APM and observability, along with examples of available tools.
Brien Posey is a former 22-time Microsoft MVP and a commercial astronaut candidate. In his more than 30 years in IT, he has served as a lead network engineer for the U.S. Department of Defense and a network administrator for some of the largest insurance companies in America.