APM vs. distributed tracing: How they differ
Application performance monitoring and distributed tracing help IT teams identify performance problems in different but complementary ways, as explained here.

No doubt we've all had the frustrating experience of selecting items in an online store, going to our cart, entering the shipping details and payment information -- and then waiting and waiting until, finally, the transaction fails. Troubleshooting such performance problems can also be frustrating for the technical teams behind the IT systems that run online stores and other applications.
While some systems involve single applications, many modern ones contain complex networks of interconnected microservices. In these architectures, it's especially difficult to debug issues that affect application performance and that block transactions from being completed. Application performance monitoring (APM) and distributed tracing are two technical processes that can help IT operations and development teams understand and fix software issues, with less frustration involved.
But APM and distributed tracing work at different levels and in quite different ways. APM offers an overview of application performance that's also used to monitor the status of business services. It answers questions such as whether the customer experience on a website is slower than usual and whether any applications are failing and, thus, affecting revenue.
With distributed tracing, application developers can see a more detailed view that follows individual user requests or customer transactions as they pass through different microservices and systems. Each step along the way is documented, and operations and development teams can identify exactly where application failures or bottlenecks occur. Let's look at the differences between it and APM in more detail, as well as how they can be used together.
This article is part of
What is APM? Application performance monitoring guide
What are the key differences between APM and distributed tracing?
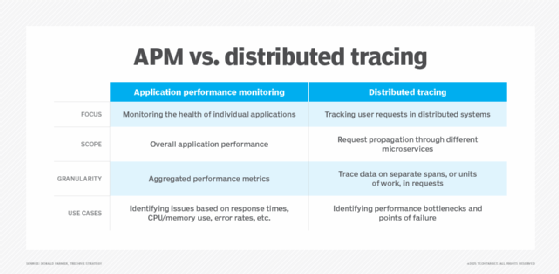
The most important difference between APM and distributed tracing is that the former monitors performance intra-service, meaning within a single application, while the latter tracks user requests and application-to-application messages inter-service -- i.e., across different ones. Other distinctions follow from this. To highlight their differences, let's look more closely at the two processes.
How application performance monitoring works
At its core, APM collects metrics and records of activities from various parts of a single application. This data includes response times, error counts, resource usage and more. It's aggregated, analyzed and visualized in dashboards, which might show both the real-time state of the application's performance and historical performance data for trend analysis.
In the example of a failed online shopping transaction mentioned above, the APM instrumentation could work as follows:
- Front-end UX monitoring captures the user's activities from product selection to checkout, measuring page load times and identifying when the UI freezes during payment processing.
- Back-end service monitoring reveals that the payment processing service is timing out because it takes too long to connect to the server handling financial transactions.
- Database monitoring discovers that locks on the application's underlying database, designed to prevent conflicting transactions, are blocking the system from updating inventory records. This is an example of monitoring dependency performance.
- Error tracking for application reliability shows that a third-party payment gateway is returning an error code and stopping the process.
Guided by the results of these and other monitoring procedures, developers should be able to identify the root causes of poor application performance and prioritize fixes based on the business impact of the performance issues.
In addition, APM tools often provide the following features:
- Customizable alerts driven by real-time performance data.
- Correlations between application behavior and IT infrastructure metrics, such as network performance.
- Business transaction monitoring to assess how application performance problems are affecting an organization's customers.
How distributed tracing works
Distributed tracing follows user requests as they travel through a distributed system. A request could be a message to retrieve data, update records or execute a function. The record of this often-intricate journey is known as a trace: a structured view of how a single request moves between multiple microservices, showing latency, dependencies and failures.
To do this, distributed tracing tools break each trace into spans -- individual units of work across services. Each span records its start and end times, along with some metadata about things such as errors and the microservice being used. All the spans with the same trace ID can then be stitched together to show the request's complete pathway through the distributed system.
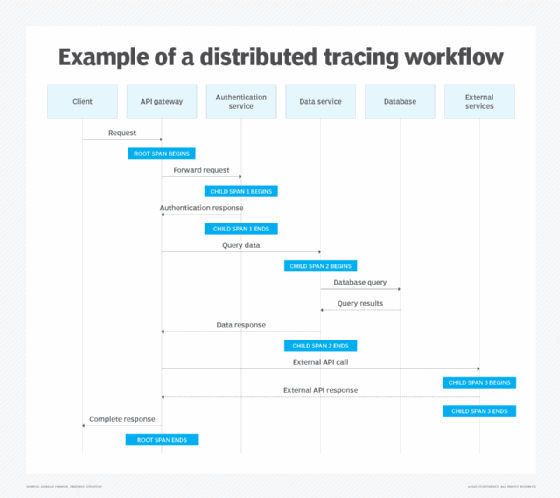
To illustrate the distributed tracing process, imagine a user has logged into a financial services web application and triggered a request to view their personal dashboard. The following workflow, which is also visualized in the chart below, shows how the request is traced as it hops between microservices:
- The root span request starts at an API gateway.
- The request is forwarded as Child Span 1 to a microservice that handles user authentication.
- Another microservice queries a customer database for recent transactions, as captured by Child Span 2.
- A third microservice makes an API call to an external service to retrieve recent data from stock market indexes, which is tracked as Child Span 3.
The tracing tool then correlates the results of similar traces involving all the application's users and visualizes the data for development teams. For example, it might display the average response time for the different spans based on the collected timestamp data and highlight ones with potential performance issues. As traces go, this is a simple one: Real applications can include numerous spans.
Scope and primary use cases of APM vs. distributed tracing
APM is best for monitoring the overall performance and health of applications over time. It's ideal for catching broad issues that affect many users. For example, APM can help developers identify a memory leak that's slowing down an entire application or analyze an increase in error rates to pinpoint the problem. APM is also the tool of choice if you're looking to optimize source code or database queries within a single application to boost its performance.
As the term indicates, distributed tracing is particularly useful for troubleshooting performance in distributed systems. For example, in a cloud-native architecture with microservices, a single user request often triggers dozens of calls between different services. In this scenario, distributed tracing excels at helping development teams debug performance bottlenecks and points of failure.
Can APM and distributed tracing work together?
Despite their differences, APM and distributed tracing are often found together in a comprehensive performance monitoring strategy. In fact, the two technologies have begun to merge somewhat. Many APM platforms now incorporate distributed tracing capabilities to generate insights into multi-service transactions. In these integrated offerings, distributed tracing is effectively a component or building block of APM. Similarly, some distributed tracing tools now offer APM-like dashboards.
So, don't think of APM and distributed tracing as mutually exclusive. They're complementary: APM provides a top-down perspective on how an application performs overall, while distributed tracing delivers a detailed bottom-up view of how a particular transaction or other user request executes across all the involved services.
The kinds of questions APM and distributed tracing can answer when used together include the following examples:
- When customers experience slow online checkouts or failed transactions, which of the many interconnected services in an application is causing the delay?
- Does a performance issue affect all customers or just a specific segment?
- Which microservices should you prioritize for development updates to improve an application's performance?
Development teams often adopt a workflow in which APM is the first line of performance analysis and tracing follows. The APM tool monitors key indicators of application performance, such as latency or error rates, and triggers an alert if something deviates from normal. Once they're alerted to a problem, software engineers use distributed tracing data to investigate why it's happening. For example, if APM dashboards show that page load times spiked at 3 p.m., a developer might pull up trace data from then to view the path of user requests and find the service or API call that was performing slowly.
This could be done within the same APM tool if it supports detailed tracing or by jumping to a standalone tracing tool. In the past, organizations had to use separate tools and manually correlate the results between them. Today's tooling is more seamlessly integrated, but the pattern remains the same: APM tells you there's an issue, and distributed tracing helps you find where and why it's occurring.
How APM and distributed tracing support observability initiatives
Observability has emerged more recently as a broader IT practice with integrated performance and status analysis that goes beyond traditional monitoring. It emphasizes exploratory analysis rather than the use of predefined dashboards. This enables IT teams to ask new questions about their systems and investigate unexpected behaviors they didn't anticipate when performance monitoring processes were first set up.
Both APM and distributed tracing can be used in observability initiatives. The metrics and traces they gather are often described as two of the three pillars of observability, along with logs. Observability practices encourage using all these signals together. In fact, modern observability platforms automatically correlate metrics, traces and logs to point software engineers toward the likely root causes of performance issues.
But observability isn't just about fighting fires. It also helps developers continuously improve system reliability and performance. Together, APM and distributed tracing provide an observability feedback loop with insight that has tangible effects: Teams should be able to detect issues more quickly and resolve them before they affect users, thereby maintaining higher system uptime and user satisfaction levels.
In short, a strong observability strategy that incorporates the different capabilities of APM and distributed tracing leads to more reliable IT systems -- and, hopefully, fewer frustrating, failed transactions when customers click the checkout button.
Donald Farmer is a data strategist with 30-plus years of experience, including as a product team leader at Microsoft and Qlik. He advises global clients on data, analytics, AI and innovation strategy, with expertise spanning from tech giants to startups.